Immigrants from Eritrea vs Greek Child Poverty Under the Age of 5
COMPARE
Immigrants from Eritrea
Greek
Child Poverty Under the Age of 5
Child Poverty Under the Age of 5 Comparison
Immigrants from Eritrea
Greeks
19.1%
CHILD POVERTY UNDER THE AGE OF 5
1.5/ 100
METRIC RATING
226th/ 347
METRIC RANK
15.2%
CHILD POVERTY UNDER THE AGE OF 5
99.0/ 100
METRIC RATING
67th/ 347
METRIC RANK
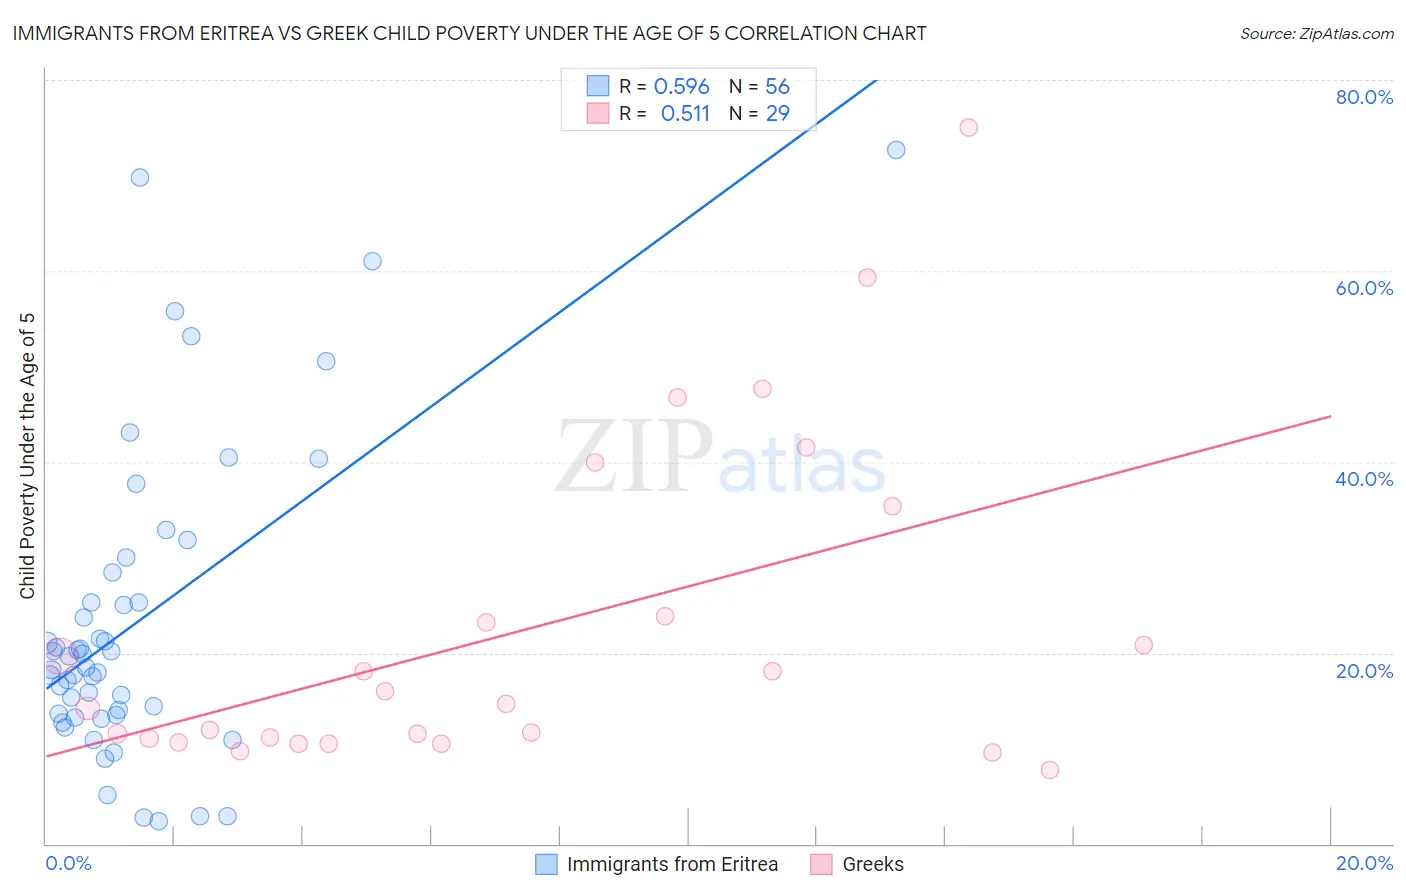
Immigrants from Eritrea vs Greek Child Poverty Under the Age of 5 Correlation Chart
The statistical analysis conducted on geographies consisting of 103,980,872 people shows a substantial positive correlation between the proportion of Immigrants from Eritrea and poverty level among children under the age of 5 in the United States with a correlation coefficient (R) of 0.596 and weighted average of 19.1%. Similarly, the statistical analysis conducted on geographies consisting of 455,265,275 people shows a substantial positive correlation between the proportion of Greeks and poverty level among children under the age of 5 in the United States with a correlation coefficient (R) of 0.511 and weighted average of 15.2%, a difference of 25.7%.
Child Poverty Under the Age of 5 Correlation Summary
| Measurement | Immigrants from Eritrea | Greek |
| Minimum | 2.3% | 7.8% |
| Maximum | 72.7% | 75.0% |
| Range | 70.4% | 67.2% |
| Mean | 23.3% | 22.5% |
| Median | 19.0% | 14.7% |
| Interquartile 25% (IQ1) | 13.6% | 10.8% |
| Interquartile 75% (IQ3) | 26.8% | 29.5% |
| Interquartile Range (IQR) | 13.2% | 18.8% |
| Standard Deviation (Sample) | 16.1% | 17.2% |
| Standard Deviation (Population) | 15.9% | 16.9% |
Similar Demographics by Child Poverty Under the Age of 5
Demographics Similar to Immigrants from Eritrea by Child Poverty Under the Age of 5
In terms of child poverty under the age of 5, the demographic groups most similar to Immigrants from Eritrea are Nigerian (19.1%, a difference of 0.020%), Nicaraguan (19.1%, a difference of 0.050%), Cuban (19.1%, a difference of 0.16%), Alsatian (19.1%, a difference of 0.18%), and Cape Verdean (19.1%, a difference of 0.18%).
| Demographics | Rating | Rank | Child Poverty Under the Age of 5 |
| German Russians | 3.0 /100 | #219 | Tragic 18.8% |
| Immigrants | Azores | 2.6 /100 | #220 | Tragic 18.9% |
| Immigrants | Nigeria | 2.1 /100 | #221 | Tragic 19.0% |
| Alsatians | 1.7 /100 | #222 | Tragic 19.1% |
| Cubans | 1.7 /100 | #223 | Tragic 19.1% |
| Nicaraguans | 1.6 /100 | #224 | Tragic 19.1% |
| Nigerians | 1.6 /100 | #225 | Tragic 19.1% |
| Immigrants | Eritrea | 1.5 /100 | #226 | Tragic 19.1% |
| Cape Verdeans | 1.4 /100 | #227 | Tragic 19.1% |
| Immigrants | Sudan | 1.3 /100 | #228 | Tragic 19.2% |
| Ghanaians | 1.2 /100 | #229 | Tragic 19.2% |
| Ecuadorians | 1.2 /100 | #230 | Tragic 19.2% |
| Bermudans | 1.2 /100 | #231 | Tragic 19.2% |
| Trinidadians and Tobagonians | 0.9 /100 | #232 | Tragic 19.3% |
| Sudanese | 0.9 /100 | #233 | Tragic 19.3% |
Demographics Similar to Greeks by Child Poverty Under the Age of 5
In terms of child poverty under the age of 5, the demographic groups most similar to Greeks are Zimbabwean (15.2%, a difference of 0.0%), Lithuanian (15.2%, a difference of 0.020%), Immigrants from Scotland (15.2%, a difference of 0.060%), Immigrants from Fiji (15.2%, a difference of 0.18%), and Immigrants from Romania (15.2%, a difference of 0.21%).
| Demographics | Rating | Rank | Child Poverty Under the Age of 5 |
| Immigrants | Russia | 99.3 /100 | #60 | Exceptional 15.0% |
| Immigrants | Poland | 99.1 /100 | #61 | Exceptional 15.1% |
| Immigrants | Eastern Europe | 99.1 /100 | #62 | Exceptional 15.1% |
| Immigrants | Europe | 99.1 /100 | #63 | Exceptional 15.1% |
| Immigrants | Romania | 99.1 /100 | #64 | Exceptional 15.2% |
| Immigrants | Fiji | 99.0 /100 | #65 | Exceptional 15.2% |
| Immigrants | Scotland | 99.0 /100 | #66 | Exceptional 15.2% |
| Greeks | 99.0 /100 | #67 | Exceptional 15.2% |
| Zimbabweans | 99.0 /100 | #68 | Exceptional 15.2% |
| Lithuanians | 99.0 /100 | #69 | Exceptional 15.2% |
| Immigrants | Belgium | 98.8 /100 | #70 | Exceptional 15.3% |
| Immigrants | Egypt | 98.8 /100 | #71 | Exceptional 15.3% |
| Immigrants | Sweden | 98.8 /100 | #72 | Exceptional 15.3% |
| Immigrants | Ukraine | 98.7 /100 | #73 | Exceptional 15.3% |
| Argentineans | 98.5 /100 | #74 | Exceptional 15.4% |