Immigrants from Eritrea vs Arab Unemployment Among Ages 60 to 64 years
COMPARE
Immigrants from Eritrea
Arab
Unemployment Among Ages 60 to 64 years
Unemployment Among Ages 60 to 64 years Comparison
Immigrants from Eritrea
Arabs
4.5%
UNEMPLOYMENT AMONG AGES 60 TO 64 YEARS
100.0/ 100
METRIC RATING
31st/ 347
METRIC RANK
4.8%
UNEMPLOYMENT AMONG AGES 60 TO 64 YEARS
78.8/ 100
METRIC RATING
149th/ 347
METRIC RANK
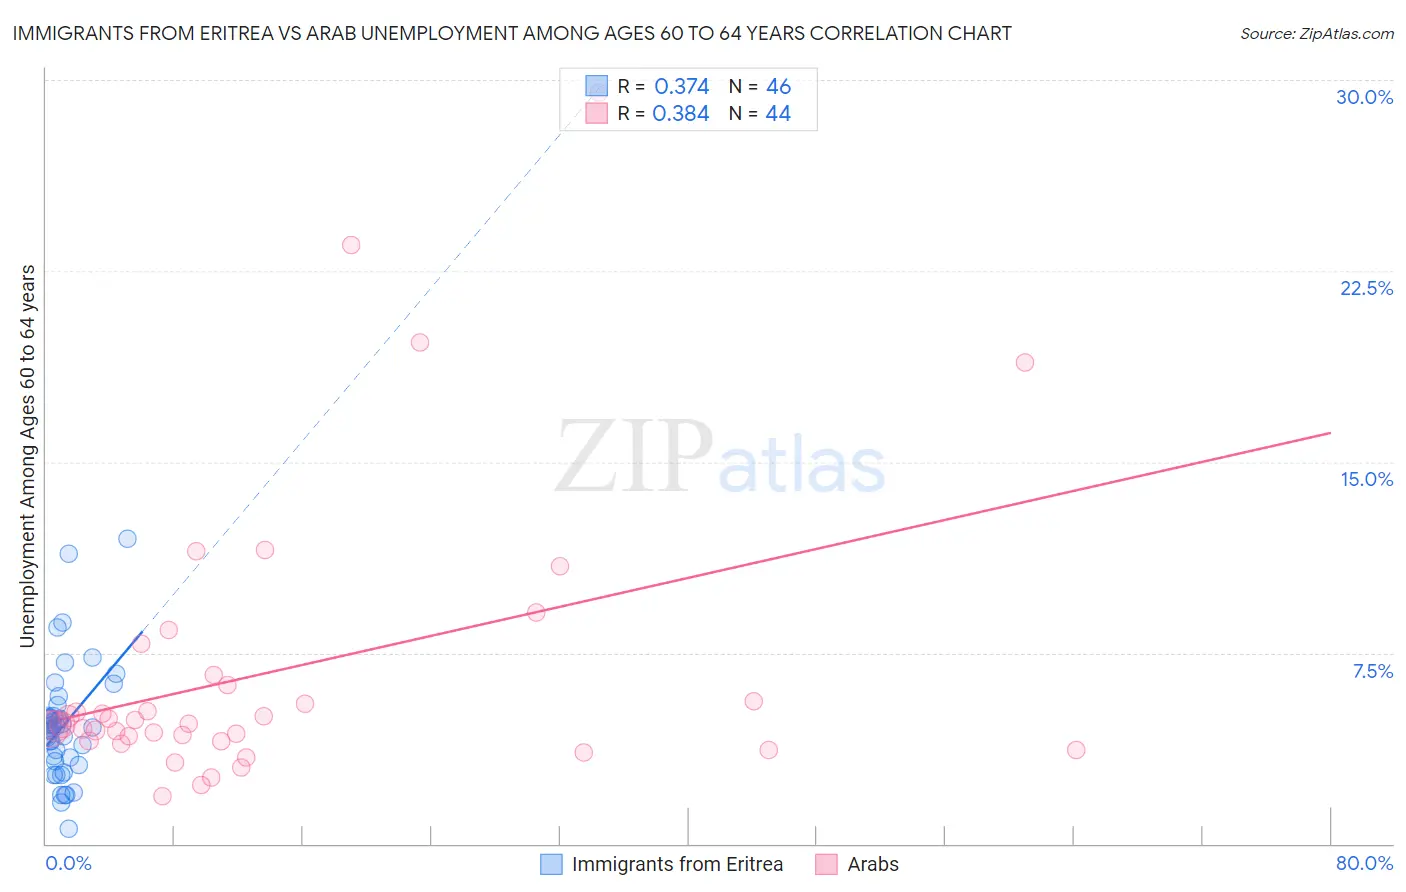
Immigrants from Eritrea vs Arab Unemployment Among Ages 60 to 64 years Correlation Chart
The statistical analysis conducted on geographies consisting of 101,843,192 people shows a mild positive correlation between the proportion of Immigrants from Eritrea and unemployment rate among population between the ages 60 and 64 in the United States with a correlation coefficient (R) of 0.374 and weighted average of 4.5%. Similarly, the statistical analysis conducted on geographies consisting of 427,513,396 people shows a mild positive correlation between the proportion of Arabs and unemployment rate among population between the ages 60 and 64 in the United States with a correlation coefficient (R) of 0.384 and weighted average of 4.8%, a difference of 7.4%.
Unemployment Among Ages 60 to 64 years Correlation Summary
| Measurement | Immigrants from Eritrea | Arab |
| Minimum | 0.60% | 1.9% |
| Maximum | 12.0% | 29.5% |
| Range | 11.4% | 27.6% |
| Mean | 4.7% | 6.8% |
| Median | 4.6% | 4.7% |
| Interquartile 25% (IQ1) | 3.2% | 4.0% |
| Interquartile 75% (IQ3) | 5.0% | 6.4% |
| Interquartile Range (IQR) | 1.8% | 2.4% |
| Standard Deviation (Sample) | 2.3% | 5.7% |
| Standard Deviation (Population) | 2.3% | 5.7% |
Similar Demographics by Unemployment Among Ages 60 to 64 years
Demographics Similar to Immigrants from Eritrea by Unemployment Among Ages 60 to 64 years
In terms of unemployment among ages 60 to 64 years, the demographic groups most similar to Immigrants from Eritrea are Zimbabwean (4.5%, a difference of 0.040%), Immigrants from Venezuela (4.5%, a difference of 0.070%), Cuban (4.5%, a difference of 0.090%), Carpatho Rusyn (4.5%, a difference of 0.090%), and Immigrants from Nepal (4.5%, a difference of 0.33%).
| Demographics | Rating | Rank | Unemployment Among Ages 60 to 64 years |
| Immigrants | Burma/Myanmar | 100.0 /100 | #24 | Exceptional 4.4% |
| Yugoslavians | 100.0 /100 | #25 | Exceptional 4.4% |
| Czechs | 100.0 /100 | #26 | Exceptional 4.4% |
| Immigrants | Iraq | 100.0 /100 | #27 | Exceptional 4.5% |
| Immigrants | Nepal | 100.0 /100 | #28 | Exceptional 4.5% |
| Cubans | 100.0 /100 | #29 | Exceptional 4.5% |
| Immigrants | Venezuela | 100.0 /100 | #30 | Exceptional 4.5% |
| Immigrants | Eritrea | 100.0 /100 | #31 | Exceptional 4.5% |
| Zimbabweans | 100.0 /100 | #32 | Exceptional 4.5% |
| Carpatho Rusyns | 100.0 /100 | #33 | Exceptional 4.5% |
| Belgians | 100.0 /100 | #34 | Exceptional 4.5% |
| Germans | 100.0 /100 | #35 | Exceptional 4.5% |
| Venezuelans | 100.0 /100 | #36 | Exceptional 4.5% |
| Immigrants | Portugal | 100.0 /100 | #37 | Exceptional 4.5% |
| Native Hawaiians | 100.0 /100 | #38 | Exceptional 4.5% |
Demographics Similar to Arabs by Unemployment Among Ages 60 to 64 years
In terms of unemployment among ages 60 to 64 years, the demographic groups most similar to Arabs are Immigrants from Italy (4.8%, a difference of 0.0%), Latvian (4.8%, a difference of 0.020%), Immigrants from South Africa (4.8%, a difference of 0.020%), Mongolian (4.8%, a difference of 0.14%), and American (4.8%, a difference of 0.16%).
| Demographics | Rating | Rank | Unemployment Among Ages 60 to 64 years |
| Immigrants | Ethiopia | 85.3 /100 | #142 | Excellent 4.8% |
| Italians | 85.0 /100 | #143 | Excellent 4.8% |
| Immigrants | Pakistan | 83.3 /100 | #144 | Excellent 4.8% |
| Burmese | 83.1 /100 | #145 | Excellent 4.8% |
| Turks | 81.9 /100 | #146 | Excellent 4.8% |
| Mongolians | 81.2 /100 | #147 | Excellent 4.8% |
| Latvians | 79.1 /100 | #148 | Good 4.8% |
| Arabs | 78.8 /100 | #149 | Good 4.8% |
| Immigrants | Italy | 78.7 /100 | #150 | Good 4.8% |
| Immigrants | South Africa | 78.5 /100 | #151 | Good 4.8% |
| Americans | 75.7 /100 | #152 | Good 4.8% |
| Bolivians | 75.5 /100 | #153 | Good 4.8% |
| Chileans | 72.6 /100 | #154 | Good 4.8% |
| Filipinos | 72.1 /100 | #155 | Good 4.8% |
| Immigrants | Bolivia | 69.2 /100 | #156 | Good 4.8% |