Immigrants from England vs Immigrants from Turkey Receiving Food Stamps
COMPARE
Immigrants from England
Immigrants from Turkey
Receiving Food Stamps
Receiving Food Stamps Comparison
Immigrants from England
Immigrants from Turkey
10.0%
RECEIVING FOOD STAMPS
98.6/ 100
METRIC RATING
81st/ 347
METRIC RANK
9.8%
RECEIVING FOOD STAMPS
99.1/ 100
METRIC RATING
65th/ 347
METRIC RANK
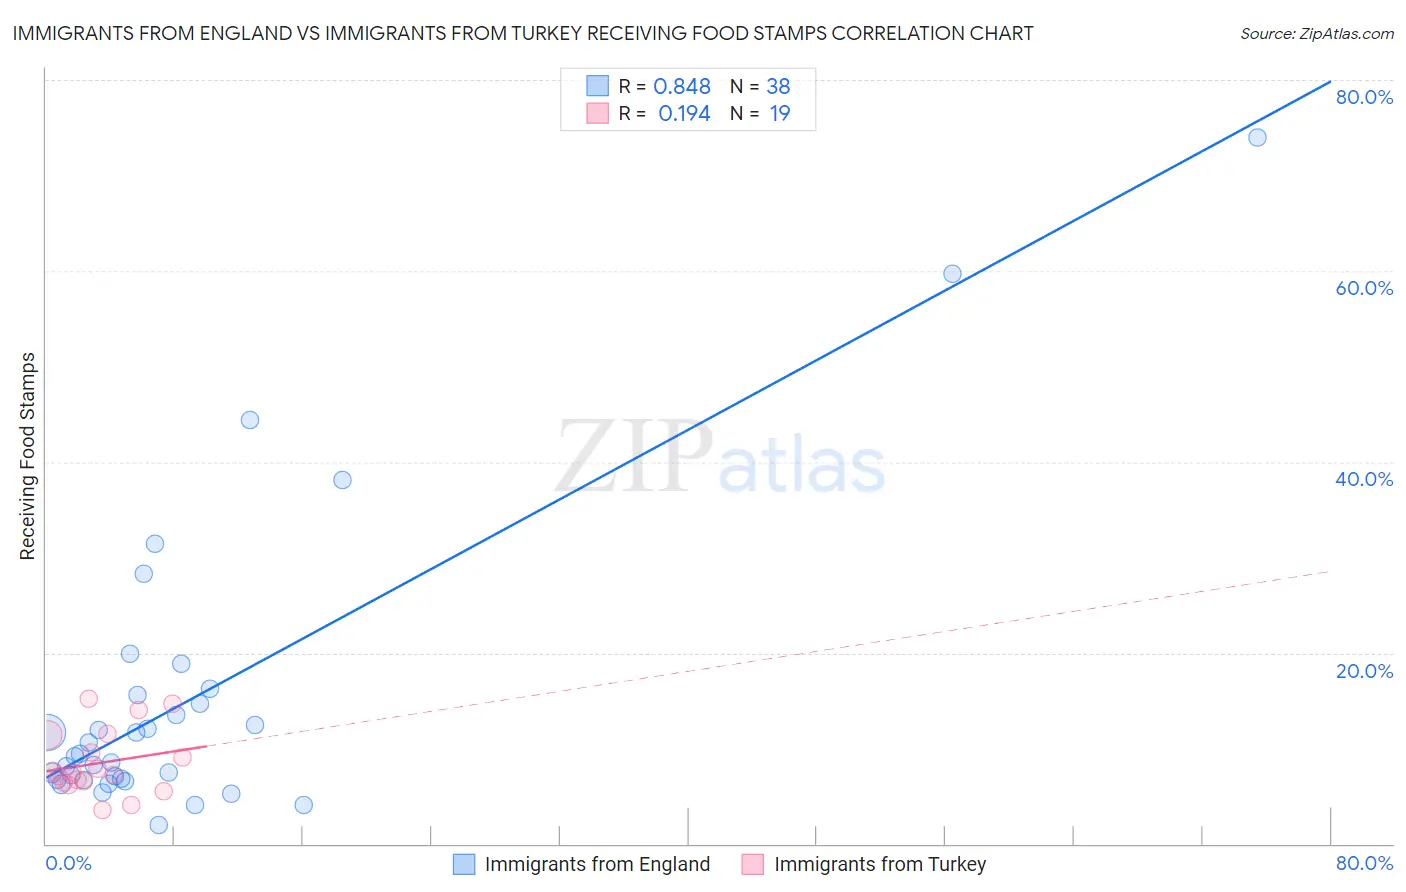
Immigrants from England vs Immigrants from Turkey Receiving Food Stamps Correlation Chart
The statistical analysis conducted on geographies consisting of 390,689,765 people shows a very strong positive correlation between the proportion of Immigrants from England and percentage of population receiving government assistance and/or food stamps in the United States with a correlation coefficient (R) of 0.848 and weighted average of 10.0%. Similarly, the statistical analysis conducted on geographies consisting of 222,535,974 people shows a poor positive correlation between the proportion of Immigrants from Turkey and percentage of population receiving government assistance and/or food stamps in the United States with a correlation coefficient (R) of 0.194 and weighted average of 9.8%, a difference of 2.0%.
Receiving Food Stamps Correlation Summary
| Measurement | Immigrants from England | Immigrants from Turkey |
| Minimum | 2.0% | 3.5% |
| Maximum | 74.0% | 15.1% |
| Range | 72.0% | 11.7% |
| Mean | 15.2% | 8.5% |
| Median | 9.3% | 7.4% |
| Interquartile 25% (IQ1) | 6.7% | 6.5% |
| Interquartile 75% (IQ3) | 15.5% | 11.4% |
| Interquartile Range (IQR) | 8.9% | 4.9% |
| Standard Deviation (Sample) | 15.5% | 3.4% |
| Standard Deviation (Population) | 15.3% | 3.3% |
Demographics Similar to Immigrants from England and Immigrants from Turkey by Receiving Food Stamps
In terms of receiving food stamps, the demographic groups most similar to Immigrants from England are Austrian (10.0%, a difference of 0.13%), Dutch (10.0%, a difference of 0.13%), Polish (10.0%, a difference of 0.14%), Laotian (10.0%, a difference of 0.22%), and South African (10.0%, a difference of 0.26%). Similarly, the demographic groups most similar to Immigrants from Turkey are Immigrants from North America (9.8%, a difference of 0.17%), Slovene (9.8%, a difference of 0.20%), Chinese (9.8%, a difference of 0.26%), Immigrants from Indonesia (9.8%, a difference of 0.36%), and Northern European (9.8%, a difference of 0.42%).
| Demographics | Rating | Rank | Receiving Food Stamps |
| Chinese | 99.2 /100 | #63 | Exceptional 9.8% |
| Immigrants | North America | 99.2 /100 | #64 | Exceptional 9.8% |
| Immigrants | Turkey | 99.1 /100 | #65 | Exceptional 9.8% |
| Slovenes | 99.1 /100 | #66 | Exceptional 9.8% |
| Immigrants | Indonesia | 99.0 /100 | #67 | Exceptional 9.8% |
| Northern Europeans | 99.0 /100 | #68 | Exceptional 9.8% |
| Italians | 99.0 /100 | #69 | Exceptional 9.9% |
| Immigrants | Serbia | 99.0 /100 | #70 | Exceptional 9.9% |
| Scottish | 98.9 /100 | #71 | Exceptional 9.9% |
| Immigrants | Asia | 98.9 /100 | #72 | Exceptional 9.9% |
| Macedonians | 98.9 /100 | #73 | Exceptional 9.9% |
| New Zealanders | 98.8 /100 | #74 | Exceptional 9.9% |
| Immigrants | Zimbabwe | 98.7 /100 | #75 | Exceptional 9.9% |
| Immigrants | Croatia | 98.7 /100 | #76 | Exceptional 10.0% |
| Immigrants | North Macedonia | 98.7 /100 | #77 | Exceptional 10.0% |
| South Africans | 98.7 /100 | #78 | Exceptional 10.0% |
| Laotians | 98.7 /100 | #79 | Exceptional 10.0% |
| Poles | 98.6 /100 | #80 | Exceptional 10.0% |
| Immigrants | England | 98.6 /100 | #81 | Exceptional 10.0% |
| Austrians | 98.6 /100 | #82 | Exceptional 10.0% |
| Dutch | 98.6 /100 | #83 | Exceptional 10.0% |