Immigrants from El Salvador vs Costa Rican Child Poverty Under the Age of 16
COMPARE
Immigrants from El Salvador
Costa Rican
Child Poverty Under the Age of 16
Child Poverty Under the Age of 16 Comparison
Immigrants from El Salvador
Costa Ricans
19.7%
CHILD POVERTY UNDER THE AGE OF 16
0.1/ 100
METRIC RATING
269th/ 347
METRIC RANK
16.0%
CHILD POVERTY UNDER THE AGE OF 16
61.1/ 100
METRIC RATING
167th/ 347
METRIC RANK
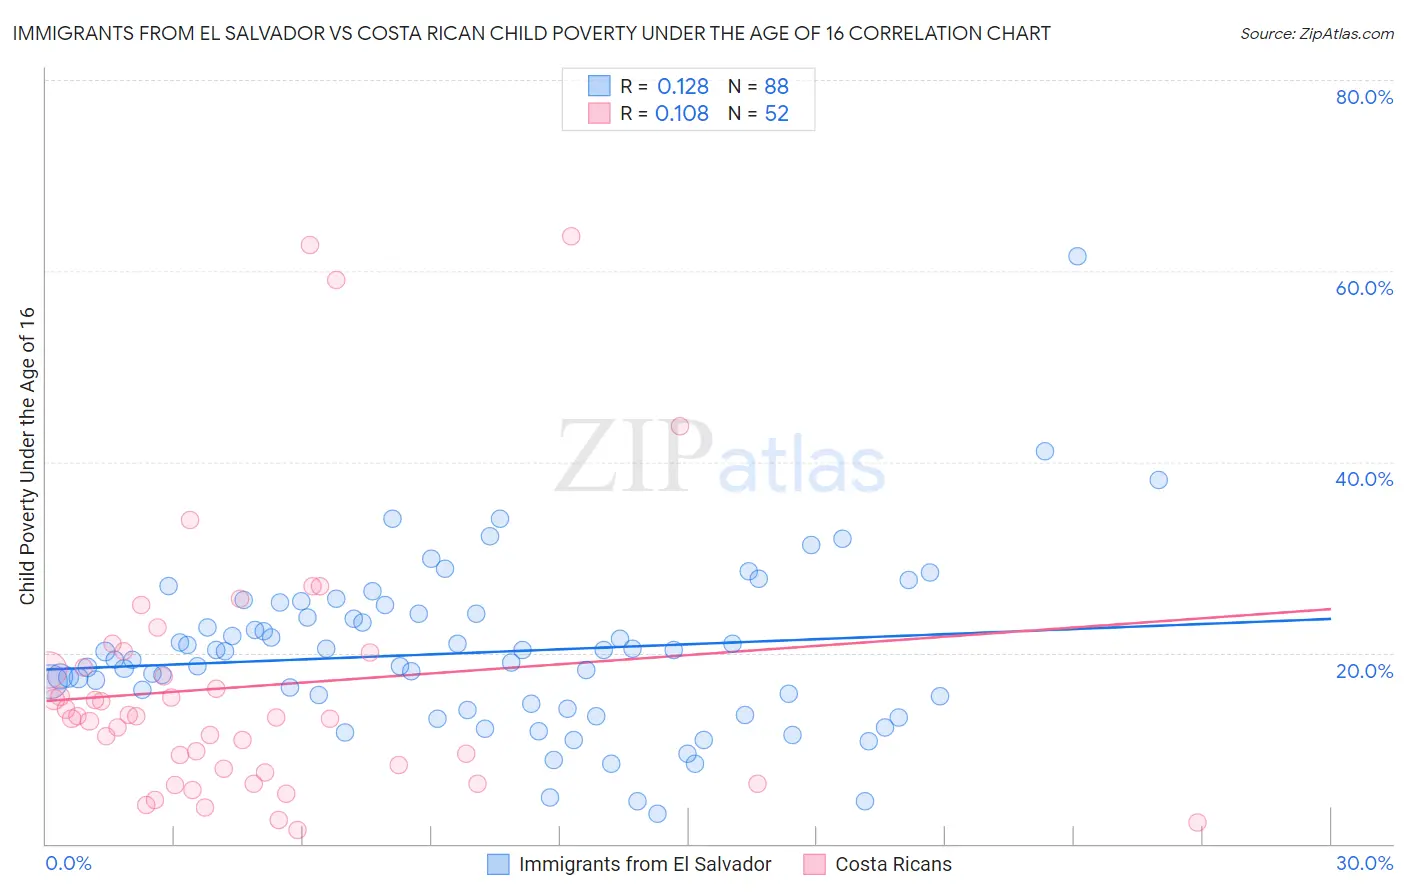
Immigrants from El Salvador vs Costa Rican Child Poverty Under the Age of 16 Correlation Chart
The statistical analysis conducted on geographies consisting of 356,111,542 people shows a poor positive correlation between the proportion of Immigrants from El Salvador and poverty level among children under the age of 16 in the United States with a correlation coefficient (R) of 0.128 and weighted average of 19.7%. Similarly, the statistical analysis conducted on geographies consisting of 252,372,287 people shows a poor positive correlation between the proportion of Costa Ricans and poverty level among children under the age of 16 in the United States with a correlation coefficient (R) of 0.108 and weighted average of 16.0%, a difference of 23.2%.
Child Poverty Under the Age of 16 Correlation Summary
| Measurement | Immigrants from El Salvador | Costa Rican |
| Minimum | 3.1% | 1.5% |
| Maximum | 61.6% | 63.6% |
| Range | 58.5% | 62.2% |
| Mean | 20.0% | 16.5% |
| Median | 19.7% | 13.3% |
| Interquartile 25% (IQ1) | 14.4% | 7.7% |
| Interquartile 75% (IQ3) | 24.1% | 19.2% |
| Interquartile Range (IQR) | 9.7% | 11.6% |
| Standard Deviation (Sample) | 8.7% | 14.0% |
| Standard Deviation (Population) | 8.7% | 13.9% |
Similar Demographics by Child Poverty Under the Age of 16
Demographics Similar to Immigrants from El Salvador by Child Poverty Under the Age of 16
In terms of child poverty under the age of 16, the demographic groups most similar to Immigrants from El Salvador are Spanish American Indian (19.7%, a difference of 0.020%), Jamaican (19.7%, a difference of 0.060%), Immigrants from Liberia (19.7%, a difference of 0.15%), Immigrants from Bangladesh (19.8%, a difference of 0.46%), and Immigrants from Jamaica (19.8%, a difference of 0.69%).
| Demographics | Rating | Rank | Child Poverty Under the Age of 16 |
| Immigrants | Guyana | 0.1 /100 | #262 | Tragic 19.4% |
| Vietnamese | 0.1 /100 | #263 | Tragic 19.4% |
| Immigrants | Ecuador | 0.1 /100 | #264 | Tragic 19.4% |
| Chickasaw | 0.1 /100 | #265 | Tragic 19.5% |
| Liberians | 0.1 /100 | #266 | Tragic 19.5% |
| Cherokee | 0.1 /100 | #267 | Tragic 19.5% |
| Jamaicans | 0.1 /100 | #268 | Tragic 19.7% |
| Immigrants | El Salvador | 0.1 /100 | #269 | Tragic 19.7% |
| Spanish American Indians | 0.1 /100 | #270 | Tragic 19.7% |
| Immigrants | Liberia | 0.1 /100 | #271 | Tragic 19.7% |
| Immigrants | Bangladesh | 0.1 /100 | #272 | Tragic 19.8% |
| Immigrants | Jamaica | 0.1 /100 | #273 | Tragic 19.8% |
| Immigrants | Cabo Verde | 0.1 /100 | #274 | Tragic 19.9% |
| Immigrants | Barbados | 0.1 /100 | #275 | Tragic 19.9% |
| Belizeans | 0.1 /100 | #276 | Tragic 19.9% |
Demographics Similar to Costa Ricans by Child Poverty Under the Age of 16
In terms of child poverty under the age of 16, the demographic groups most similar to Costa Ricans are South American (16.0%, a difference of 0.40%), Immigrants from Oceania (15.9%, a difference of 0.57%), Guamanian/Chamorro (15.9%, a difference of 0.70%), Uruguayan (16.1%, a difference of 0.80%), and Immigrants from Germany (15.8%, a difference of 0.84%).
| Demographics | Rating | Rank | Child Poverty Under the Age of 16 |
| Immigrants | Albania | 70.7 /100 | #160 | Good 15.8% |
| Immigrants | Northern Africa | 68.1 /100 | #161 | Good 15.8% |
| Colombians | 67.6 /100 | #162 | Good 15.8% |
| Yugoslavians | 67.6 /100 | #163 | Good 15.8% |
| Immigrants | Germany | 67.3 /100 | #164 | Good 15.8% |
| Guamanians/Chamorros | 66.4 /100 | #165 | Good 15.9% |
| Immigrants | Oceania | 65.4 /100 | #166 | Good 15.9% |
| Costa Ricans | 61.1 /100 | #167 | Good 16.0% |
| South Americans | 57.9 /100 | #168 | Average 16.0% |
| Uruguayans | 54.7 /100 | #169 | Average 16.1% |
| Immigrants | Colombia | 54.4 /100 | #170 | Average 16.1% |
| Hungarians | 52.5 /100 | #171 | Average 16.2% |
| Afghans | 52.3 /100 | #172 | Average 16.2% |
| Immigrants | Saudi Arabia | 52.1 /100 | #173 | Average 16.2% |
| Whites/Caucasians | 50.0 /100 | #174 | Average 16.2% |