Immigrants from Ecuador vs Celtic Single Father Households
COMPARE
Immigrants from Ecuador
Celtic
Single Father Households
Single Father Households Comparison
Immigrants from Ecuador
Celtics
2.4%
SINGLE FATHER HOUSEHOLDS
14.9/ 100
METRIC RATING
216th/ 347
METRIC RANK
2.3%
SINGLE FATHER HOUSEHOLDS
55.4/ 100
METRIC RATING
173rd/ 347
METRIC RANK
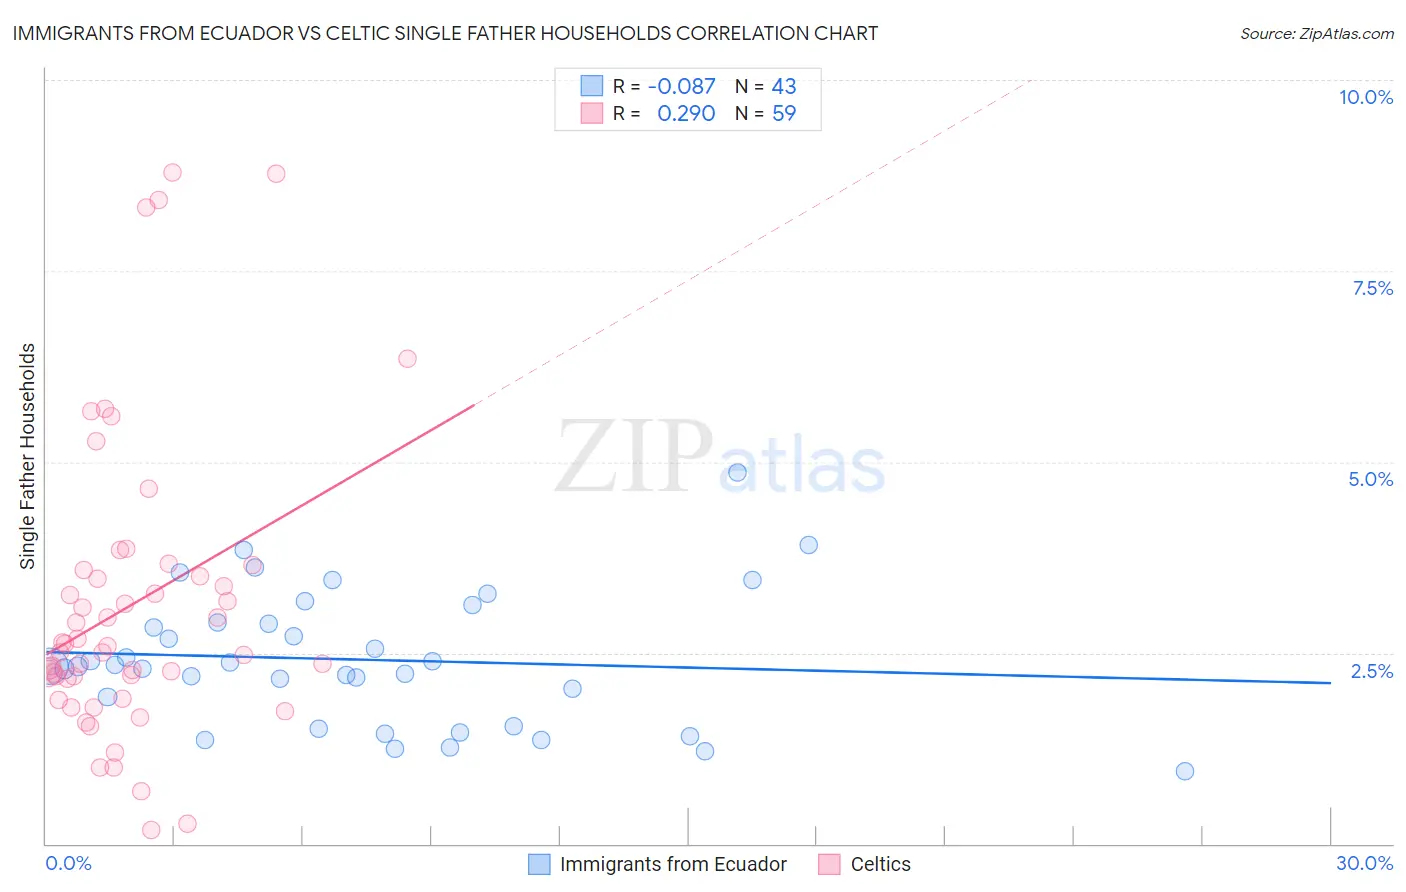
Immigrants from Ecuador vs Celtic Single Father Households Correlation Chart
The statistical analysis conducted on geographies consisting of 269,379,294 people shows a slight negative correlation between the proportion of Immigrants from Ecuador and percentage of single father households in the United States with a correlation coefficient (R) of -0.087 and weighted average of 2.4%. Similarly, the statistical analysis conducted on geographies consisting of 168,269,233 people shows a weak positive correlation between the proportion of Celtics and percentage of single father households in the United States with a correlation coefficient (R) of 0.290 and weighted average of 2.3%, a difference of 3.6%.
Single Father Households Correlation Summary
| Measurement | Immigrants from Ecuador | Celtic |
| Minimum | 0.94% | 0.17% |
| Maximum | 4.9% | 8.8% |
| Range | 3.9% | 8.6% |
| Mean | 2.4% | 3.1% |
| Median | 2.3% | 2.6% |
| Interquartile 25% (IQ1) | 1.5% | 2.2% |
| Interquartile 75% (IQ3) | 2.9% | 3.6% |
| Interquartile Range (IQR) | 1.4% | 1.4% |
| Standard Deviation (Sample) | 0.87% | 1.9% |
| Standard Deviation (Population) | 0.86% | 1.9% |
Similar Demographics by Single Father Households
Demographics Similar to Immigrants from Ecuador by Single Father Households
In terms of single father households, the demographic groups most similar to Immigrants from Ecuador are Dutch (2.4%, a difference of 0.090%), Immigrants from South Eastern Asia (2.4%, a difference of 0.13%), Immigrants from Ethiopia (2.4%, a difference of 0.22%), Ethiopian (2.4%, a difference of 0.23%), and Norwegian (2.4%, a difference of 0.29%).
| Demographics | Rating | Rank | Single Father Households |
| Immigrants | Peru | 19.3 /100 | #209 | Poor 2.4% |
| Immigrants | Costa Rica | 19.2 /100 | #210 | Poor 2.4% |
| Immigrants | Nigeria | 18.7 /100 | #211 | Poor 2.4% |
| Finns | 18.3 /100 | #212 | Poor 2.4% |
| Norwegians | 17.1 /100 | #213 | Poor 2.4% |
| Ethiopians | 16.6 /100 | #214 | Poor 2.4% |
| Immigrants | South Eastern Asia | 15.9 /100 | #215 | Poor 2.4% |
| Immigrants | Ecuador | 14.9 /100 | #216 | Poor 2.4% |
| Dutch | 14.3 /100 | #217 | Poor 2.4% |
| Immigrants | Ethiopia | 13.4 /100 | #218 | Poor 2.4% |
| Sudanese | 13.0 /100 | #219 | Poor 2.4% |
| Ghanaians | 12.9 /100 | #220 | Poor 2.4% |
| Immigrants | Burma/Myanmar | 12.1 /100 | #221 | Poor 2.4% |
| Immigrants | Eastern Africa | 11.9 /100 | #222 | Poor 2.4% |
| Immigrants | Uruguay | 11.0 /100 | #223 | Poor 2.4% |
Demographics Similar to Celtics by Single Father Households
In terms of single father households, the demographic groups most similar to Celtics are Czechoslovakian (2.3%, a difference of 0.26%), Afghan (2.3%, a difference of 0.40%), Swedish (2.3%, a difference of 0.47%), Immigrants from Jamaica (2.3%, a difference of 0.47%), and Ugandan (2.3%, a difference of 0.52%).
| Demographics | Rating | Rank | Single Father Households |
| English | 68.6 /100 | #166 | Good 2.3% |
| South Americans | 64.3 /100 | #167 | Good 2.3% |
| Icelanders | 63.1 /100 | #168 | Good 2.3% |
| Czechs | 62.5 /100 | #169 | Good 2.3% |
| Ugandans | 62.2 /100 | #170 | Good 2.3% |
| Swedes | 61.6 /100 | #171 | Good 2.3% |
| Czechoslovakians | 58.9 /100 | #172 | Average 2.3% |
| Celtics | 55.4 /100 | #173 | Average 2.3% |
| Afghans | 50.0 /100 | #174 | Average 2.3% |
| Immigrants | Jamaica | 49.1 /100 | #175 | Average 2.3% |
| Danes | 48.2 /100 | #176 | Average 2.3% |
| Colombians | 48.0 /100 | #177 | Average 2.3% |
| Costa Ricans | 44.1 /100 | #178 | Average 2.3% |
| Welsh | 44.0 /100 | #179 | Average 2.3% |
| Yugoslavians | 43.9 /100 | #180 | Average 2.3% |