Immigrants from Eastern Europe vs Tlingit-Haida Child Poverty Among Girls Under 16
COMPARE
Immigrants from Eastern Europe
Tlingit-Haida
Child Poverty Among Girls Under 16
Child Poverty Among Girls Under 16 Comparison
Immigrants from Eastern Europe
Tlingit-Haida
14.6%
CHILD POVERTY AMONG GIRLS UNDER 16
98.0/ 100
METRIC RATING
75th/ 347
METRIC RANK
14.7%
CHILD POVERTY AMONG GIRLS UNDER 16
97.9/ 100
METRIC RATING
77th/ 347
METRIC RANK
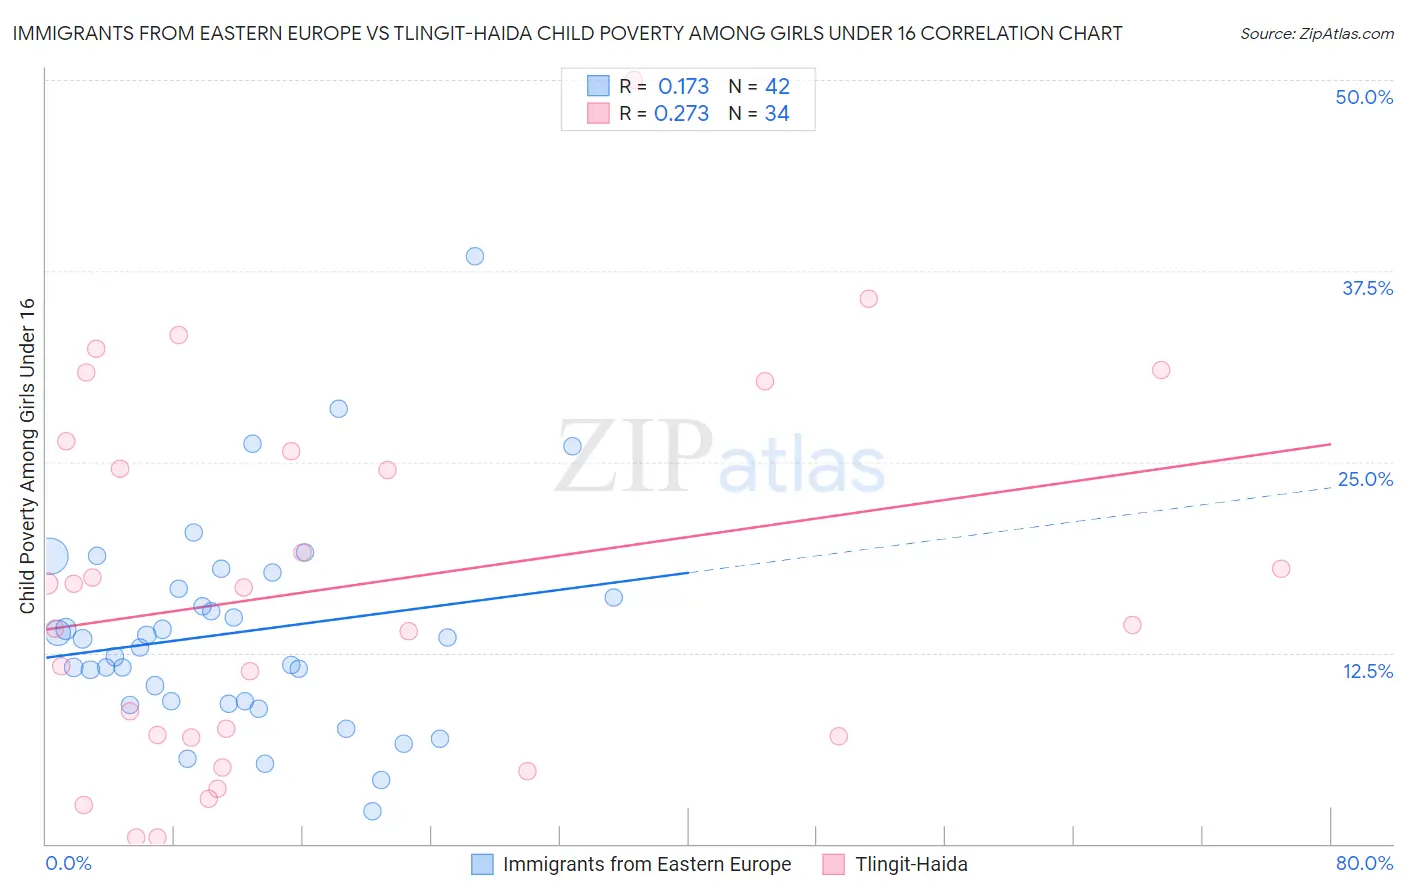
Immigrants from Eastern Europe vs Tlingit-Haida Child Poverty Among Girls Under 16 Correlation Chart
The statistical analysis conducted on geographies consisting of 462,372,791 people shows a poor positive correlation between the proportion of Immigrants from Eastern Europe and poverty level among girls under the age of 16 in the United States with a correlation coefficient (R) of 0.173 and weighted average of 14.6%. Similarly, the statistical analysis conducted on geographies consisting of 60,606,017 people shows a weak positive correlation between the proportion of Tlingit-Haida and poverty level among girls under the age of 16 in the United States with a correlation coefficient (R) of 0.273 and weighted average of 14.7%, a difference of 0.16%.
Child Poverty Among Girls Under 16 Correlation Summary
| Measurement | Immigrants from Eastern Europe | Tlingit-Haida |
| Minimum | 2.1% | 0.43% |
| Maximum | 38.5% | 50.0% |
| Range | 36.4% | 49.6% |
| Mean | 13.8% | 16.8% |
| Median | 13.1% | 15.6% |
| Interquartile 25% (IQ1) | 9.3% | 7.0% |
| Interquartile 75% (IQ3) | 16.7% | 25.7% |
| Interquartile Range (IQR) | 7.4% | 18.7% |
| Standard Deviation (Sample) | 6.9% | 12.0% |
| Standard Deviation (Population) | 6.8% | 11.8% |
Demographics Similar to Immigrants from Eastern Europe and Tlingit-Haida by Child Poverty Among Girls Under 16
In terms of child poverty among girls under 16, the demographic groups most similar to Immigrants from Eastern Europe are Taiwanese (14.6%, a difference of 0.070%), Immigrants from Austria (14.6%, a difference of 0.10%), Immigrants from Russia (14.7%, a difference of 0.15%), Argentinean (14.7%, a difference of 0.16%), and Immigrants from Turkey (14.7%, a difference of 0.18%). Similarly, the demographic groups most similar to Tlingit-Haida are Immigrants from Russia (14.7%, a difference of 0.010%), Argentinean (14.7%, a difference of 0.010%), Immigrants from Turkey (14.7%, a difference of 0.020%), Egyptian (14.7%, a difference of 0.030%), and Ukrainian (14.7%, a difference of 0.22%).
| Demographics | Rating | Rank | Child Poverty Among Girls Under 16 |
| Immigrants | Belgium | 98.5 /100 | #66 | Exceptional 14.5% |
| Laotians | 98.4 /100 | #67 | Exceptional 14.5% |
| Immigrants | Argentina | 98.3 /100 | #68 | Exceptional 14.6% |
| Immigrants | Poland | 98.2 /100 | #69 | Exceptional 14.6% |
| Europeans | 98.1 /100 | #70 | Exceptional 14.6% |
| Slovenes | 98.1 /100 | #71 | Exceptional 14.6% |
| Immigrants | Netherlands | 98.1 /100 | #72 | Exceptional 14.6% |
| Immigrants | Austria | 98.0 /100 | #73 | Exceptional 14.6% |
| Taiwanese | 98.0 /100 | #74 | Exceptional 14.6% |
| Immigrants | Eastern Europe | 98.0 /100 | #75 | Exceptional 14.6% |
| Immigrants | Russia | 97.9 /100 | #76 | Exceptional 14.7% |
| Tlingit-Haida | 97.9 /100 | #77 | Exceptional 14.7% |
| Argentineans | 97.9 /100 | #78 | Exceptional 14.7% |
| Immigrants | Turkey | 97.9 /100 | #79 | Exceptional 14.7% |
| Egyptians | 97.9 /100 | #80 | Exceptional 14.7% |
| Ukrainians | 97.7 /100 | #81 | Exceptional 14.7% |
| Macedonians | 97.6 /100 | #82 | Exceptional 14.7% |
| Immigrants | Italy | 97.4 /100 | #83 | Exceptional 14.8% |
| Soviet Union | 97.3 /100 | #84 | Exceptional 14.8% |
| Swiss | 97.2 /100 | #85 | Exceptional 14.8% |
| Australians | 97.2 /100 | #86 | Exceptional 14.8% |