Immigrants from Eastern Africa vs Immigrants from Sierra Leone 5th Grade
COMPARE
Immigrants from Eastern Africa
Immigrants from Sierra Leone
5th Grade
5th Grade Comparison
Immigrants from Eastern Africa
Immigrants from Sierra Leone
96.9%
5TH GRADE
1.6/ 100
METRIC RATING
243rd/ 347
METRIC RANK
96.8%
5TH GRADE
0.4/ 100
METRIC RATING
261st/ 347
METRIC RANK
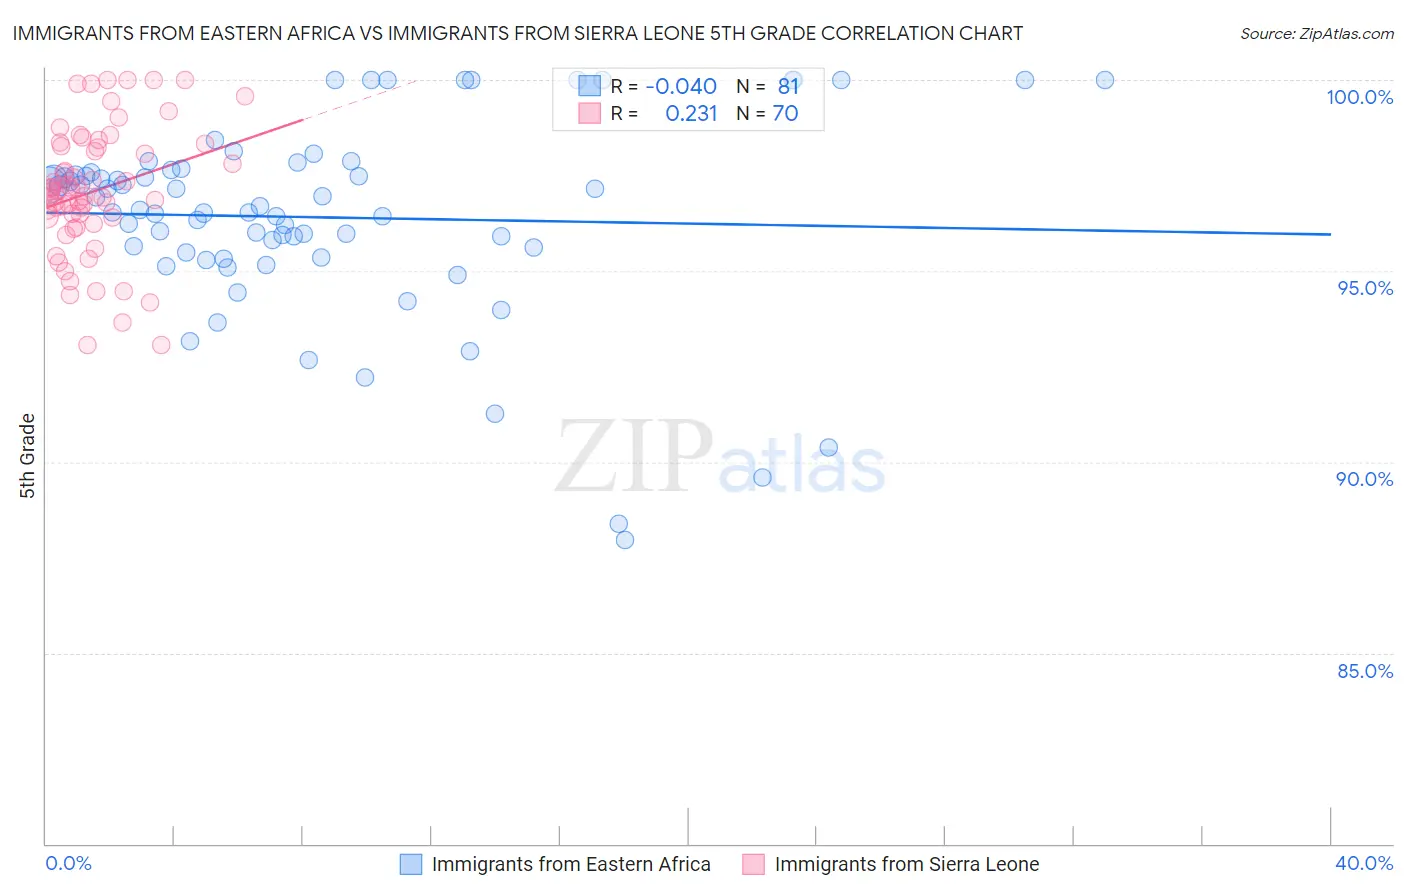
Immigrants from Eastern Africa vs Immigrants from Sierra Leone 5th Grade Correlation Chart
The statistical analysis conducted on geographies consisting of 355,144,184 people shows no correlation between the proportion of Immigrants from Eastern Africa and percentage of population with at least 5th grade education in the United States with a correlation coefficient (R) of -0.040 and weighted average of 96.9%. Similarly, the statistical analysis conducted on geographies consisting of 101,634,956 people shows a weak positive correlation between the proportion of Immigrants from Sierra Leone and percentage of population with at least 5th grade education in the United States with a correlation coefficient (R) of 0.231 and weighted average of 96.8%, a difference of 0.15%.
5th Grade Correlation Summary
| Measurement | Immigrants from Eastern Africa | Immigrants from Sierra Leone |
| Minimum | 87.9% | 93.1% |
| Maximum | 100.0% | 100.0% |
| Range | 12.1% | 6.9% |
| Mean | 96.4% | 97.1% |
| Median | 96.6% | 97.1% |
| Interquartile 25% (IQ1) | 95.4% | 96.4% |
| Interquartile 75% (IQ3) | 97.6% | 98.3% |
| Interquartile Range (IQR) | 2.2% | 1.9% |
| Standard Deviation (Sample) | 2.6% | 1.7% |
| Standard Deviation (Population) | 2.6% | 1.7% |
Demographics Similar to Immigrants from Eastern Africa and Immigrants from Sierra Leone by 5th Grade
In terms of 5th grade, the demographic groups most similar to Immigrants from Eastern Africa are Immigrants from Costa Rica (96.9%, a difference of 0.0%), Korean (96.9%, a difference of 0.0%), Colombian (96.9%, a difference of 0.020%), Ethiopian (96.9%, a difference of 0.030%), and Immigrants from Africa (96.9%, a difference of 0.040%). Similarly, the demographic groups most similar to Immigrants from Sierra Leone are Immigrants from Jamaica (96.8%, a difference of 0.0%), Immigrants from Colombia (96.8%, a difference of 0.0%), Immigrants from Ethiopia (96.8%, a difference of 0.020%), Immigrants from China (96.8%, a difference of 0.020%), and Peruvian (96.8%, a difference of 0.050%).
| Demographics | Rating | Rank | 5th Grade |
| Immigrants | Costa Rica | 1.6 /100 | #242 | Tragic 96.9% |
| Immigrants | Eastern Africa | 1.6 /100 | #243 | Tragic 96.9% |
| Koreans | 1.6 /100 | #244 | Tragic 96.9% |
| Colombians | 1.3 /100 | #245 | Tragic 96.9% |
| Ethiopians | 1.2 /100 | #246 | Tragic 96.9% |
| Immigrants | Africa | 1.1 /100 | #247 | Tragic 96.9% |
| U.S. Virgin Islanders | 1.1 /100 | #248 | Tragic 96.9% |
| Immigrants | Uruguay | 1.0 /100 | #249 | Tragic 96.9% |
| Immigrants | Liberia | 1.0 /100 | #250 | Tragic 96.9% |
| Bolivians | 0.9 /100 | #251 | Tragic 96.9% |
| Jamaicans | 0.9 /100 | #252 | Tragic 96.9% |
| Immigrants | Middle Africa | 0.8 /100 | #253 | Tragic 96.8% |
| Immigrants | Senegal | 0.8 /100 | #254 | Tragic 96.8% |
| South Americans | 0.7 /100 | #255 | Tragic 96.8% |
| Immigrants | Congo | 0.7 /100 | #256 | Tragic 96.8% |
| Peruvians | 0.6 /100 | #257 | Tragic 96.8% |
| Immigrants | Ethiopia | 0.5 /100 | #258 | Tragic 96.8% |
| Immigrants | China | 0.5 /100 | #259 | Tragic 96.8% |
| Immigrants | Jamaica | 0.4 /100 | #260 | Tragic 96.8% |
| Immigrants | Sierra Leone | 0.4 /100 | #261 | Tragic 96.8% |
| Immigrants | Colombia | 0.4 /100 | #262 | Tragic 96.8% |