Immigrants from Uruguay vs Slovak Single Male Poverty
COMPARE
Immigrants from Uruguay
Slovak
Single Male Poverty
Single Male Poverty Comparison
Immigrants from Uruguay
Slovaks
11.9%
SINGLE MALE POVERTY
99.6/ 100
METRIC RATING
66th/ 347
METRIC RANK
14.1%
SINGLE MALE POVERTY
0.0/ 100
METRIC RATING
278th/ 347
METRIC RANK
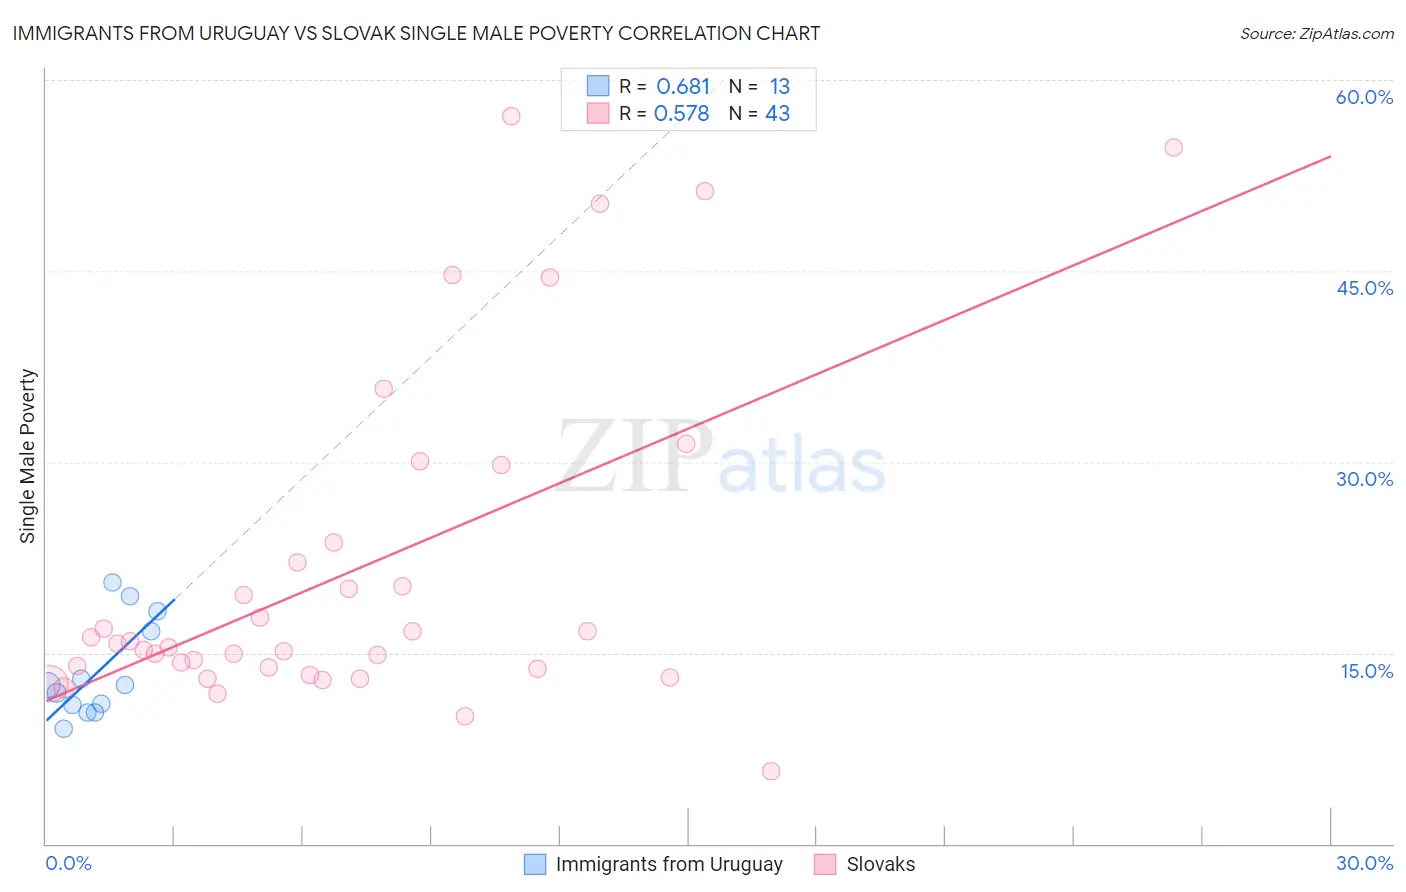
Immigrants from Uruguay vs Slovak Single Male Poverty Correlation Chart
The statistical analysis conducted on geographies consisting of 126,342,456 people shows a significant positive correlation between the proportion of Immigrants from Uruguay and poverty level among single males in the United States with a correlation coefficient (R) of 0.681 and weighted average of 11.9%. Similarly, the statistical analysis conducted on geographies consisting of 343,124,767 people shows a substantial positive correlation between the proportion of Slovaks and poverty level among single males in the United States with a correlation coefficient (R) of 0.578 and weighted average of 14.1%, a difference of 18.8%.
Single Male Poverty Correlation Summary
| Measurement | Immigrants from Uruguay | Slovak |
| Minimum | 9.1% | 5.7% |
| Maximum | 20.5% | 57.1% |
| Range | 11.5% | 51.4% |
| Mean | 13.6% | 21.6% |
| Median | 12.4% | 15.7% |
| Interquartile 25% (IQ1) | 10.6% | 13.8% |
| Interquartile 75% (IQ3) | 17.5% | 23.6% |
| Interquartile Range (IQR) | 6.9% | 9.9% |
| Standard Deviation (Sample) | 3.8% | 13.2% |
| Standard Deviation (Population) | 3.7% | 13.0% |
Similar Demographics by Single Male Poverty
Demographics Similar to Immigrants from Uruguay by Single Male Poverty
In terms of single male poverty, the demographic groups most similar to Immigrants from Uruguay are Laotian (11.9%, a difference of 0.0%), Immigrants from Ukraine (11.9%, a difference of 0.020%), Immigrants from Croatia (11.9%, a difference of 0.030%), Immigrants from Russia (11.9%, a difference of 0.060%), and Immigrants from Nepal (11.9%, a difference of 0.080%).
| Demographics | Rating | Rank | Single Male Poverty |
| Brazilians | 99.8 /100 | #59 | Exceptional 11.8% |
| Peruvians | 99.8 /100 | #60 | Exceptional 11.8% |
| Cambodians | 99.8 /100 | #61 | Exceptional 11.8% |
| Immigrants | Sri Lanka | 99.7 /100 | #62 | Exceptional 11.8% |
| Immigrants | Belarus | 99.7 /100 | #63 | Exceptional 11.8% |
| Immigrants | Eastern Europe | 99.6 /100 | #64 | Exceptional 11.8% |
| Laotians | 99.6 /100 | #65 | Exceptional 11.9% |
| Immigrants | Uruguay | 99.6 /100 | #66 | Exceptional 11.9% |
| Immigrants | Ukraine | 99.6 /100 | #67 | Exceptional 11.9% |
| Immigrants | Croatia | 99.6 /100 | #68 | Exceptional 11.9% |
| Immigrants | Russia | 99.6 /100 | #69 | Exceptional 11.9% |
| Immigrants | Nepal | 99.6 /100 | #70 | Exceptional 11.9% |
| Immigrants | Greece | 99.6 /100 | #71 | Exceptional 11.9% |
| Immigrants | Argentina | 99.5 /100 | #72 | Exceptional 11.9% |
| Argentineans | 99.5 /100 | #73 | Exceptional 11.9% |
Demographics Similar to Slovaks by Single Male Poverty
In terms of single male poverty, the demographic groups most similar to Slovaks are Indonesian (14.1%, a difference of 0.040%), Immigrants from Honduras (14.1%, a difference of 0.060%), Dutch (14.1%, a difference of 0.10%), English (14.1%, a difference of 0.22%), and Honduran (14.0%, a difference of 0.30%).
| Demographics | Rating | Rank | Single Male Poverty |
| Irish | 0.1 /100 | #271 | Tragic 14.0% |
| Mexicans | 0.1 /100 | #272 | Tragic 14.0% |
| Welsh | 0.1 /100 | #273 | Tragic 14.0% |
| Hondurans | 0.1 /100 | #274 | Tragic 14.0% |
| English | 0.1 /100 | #275 | Tragic 14.1% |
| Dutch | 0.1 /100 | #276 | Tragic 14.1% |
| Immigrants | Honduras | 0.0 /100 | #277 | Tragic 14.1% |
| Slovaks | 0.0 /100 | #278 | Tragic 14.1% |
| Indonesians | 0.0 /100 | #279 | Tragic 14.1% |
| Hmong | 0.0 /100 | #280 | Tragic 14.2% |
| Hispanics or Latinos | 0.0 /100 | #281 | Tragic 14.2% |
| Spanish Americans | 0.0 /100 | #282 | Tragic 14.2% |
| Yaqui | 0.0 /100 | #283 | Tragic 14.2% |
| Immigrants | Bahamas | 0.0 /100 | #284 | Tragic 14.4% |
| French | 0.0 /100 | #285 | Tragic 14.4% |