Immigrants from Dominica vs Immigrants from France Single Father Poverty
COMPARE
Immigrants from Dominica
Immigrants from France
Single Father Poverty
Single Father Poverty Comparison
Immigrants from Dominica
Immigrants from France
18.9%
SINGLE FATHER POVERTY
0.0/ 100
METRIC RATING
312th/ 347
METRIC RANK
16.1%
SINGLE FATHER POVERTY
73.1/ 100
METRIC RATING
151st/ 347
METRIC RANK
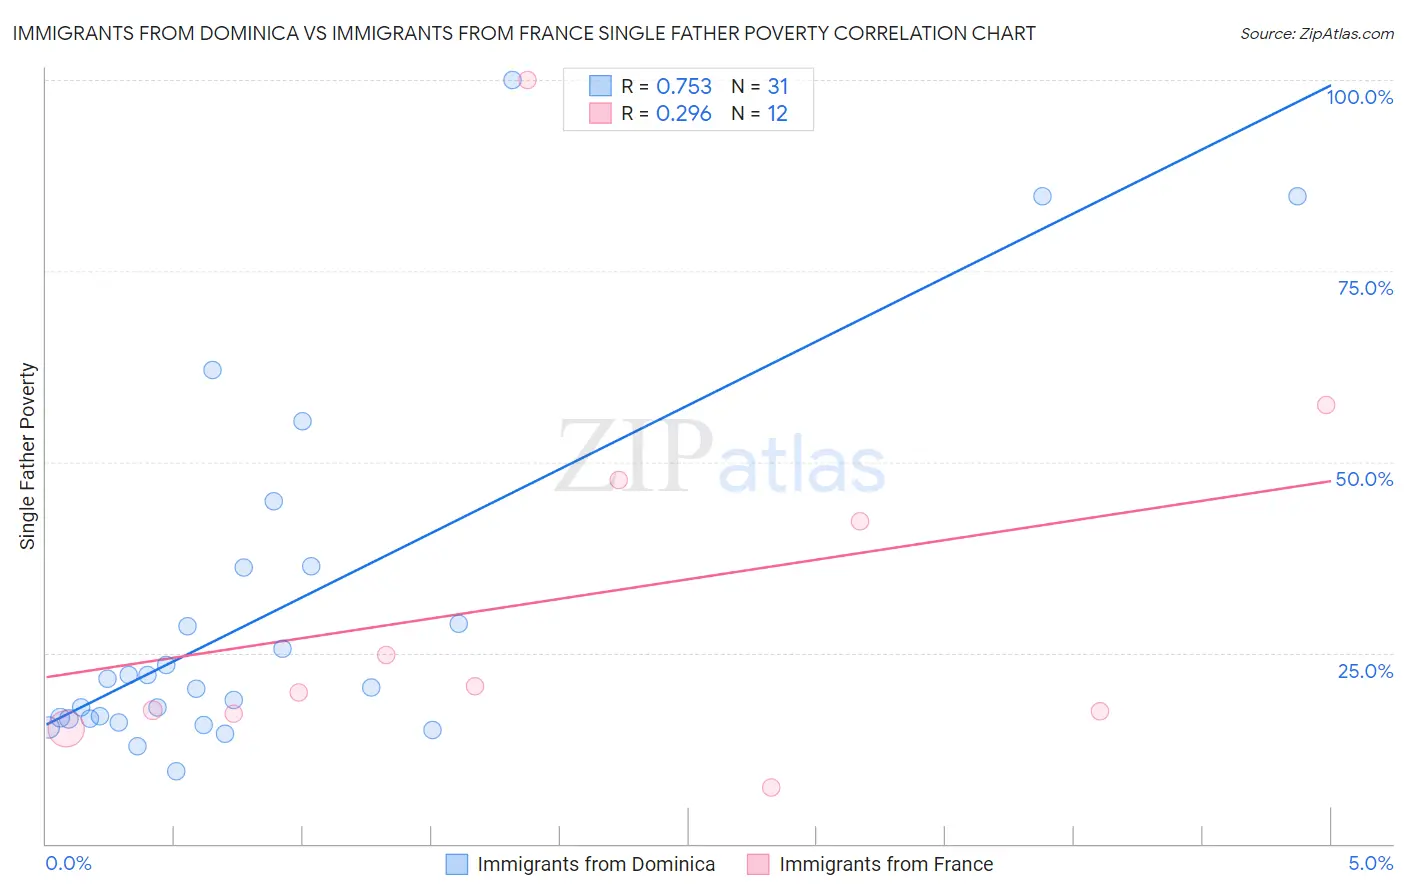
Immigrants from Dominica vs Immigrants from France Single Father Poverty Correlation Chart
The statistical analysis conducted on geographies consisting of 78,251,177 people shows a strong positive correlation between the proportion of Immigrants from Dominica and poverty level among single fathers in the United States with a correlation coefficient (R) of 0.753 and weighted average of 18.9%. Similarly, the statistical analysis conducted on geographies consisting of 232,790,194 people shows a weak positive correlation between the proportion of Immigrants from France and poverty level among single fathers in the United States with a correlation coefficient (R) of 0.296 and weighted average of 16.1%, a difference of 17.0%.
Single Father Poverty Correlation Summary
| Measurement | Immigrants from Dominica | Immigrants from France |
| Minimum | 9.4% | 7.4% |
| Maximum | 100.0% | 100.0% |
| Range | 90.6% | 92.6% |
| Mean | 30.2% | 32.2% |
| Median | 20.5% | 20.2% |
| Interquartile 25% (IQ1) | 16.4% | 17.2% |
| Interquartile 75% (IQ3) | 36.1% | 45.0% |
| Interquartile Range (IQR) | 19.7% | 27.8% |
| Standard Deviation (Sample) | 23.3% | 26.1% |
| Standard Deviation (Population) | 22.9% | 25.0% |
Similar Demographics by Single Father Poverty
Demographics Similar to Immigrants from Dominica by Single Father Poverty
In terms of single father poverty, the demographic groups most similar to Immigrants from Dominica are Nonimmigrants (18.8%, a difference of 0.050%), Potawatomi (18.9%, a difference of 0.20%), Chippewa (18.8%, a difference of 0.24%), Delaware (18.9%, a difference of 0.36%), and Chickasaw (19.0%, a difference of 0.52%).
| Demographics | Rating | Rank | Single Father Poverty |
| Blackfeet | 0.0 /100 | #305 | Tragic 18.5% |
| Scotch-Irish | 0.0 /100 | #306 | Tragic 18.6% |
| French Canadians | 0.0 /100 | #307 | Tragic 18.6% |
| Ottawa | 0.0 /100 | #308 | Tragic 18.6% |
| Immigrants | Micronesia | 0.0 /100 | #309 | Tragic 18.6% |
| Chippewa | 0.0 /100 | #310 | Tragic 18.8% |
| Immigrants | Nonimmigrants | 0.0 /100 | #311 | Tragic 18.8% |
| Immigrants | Dominica | 0.0 /100 | #312 | Tragic 18.9% |
| Potawatomi | 0.0 /100 | #313 | Tragic 18.9% |
| Delaware | 0.0 /100 | #314 | Tragic 18.9% |
| Chickasaw | 0.0 /100 | #315 | Tragic 19.0% |
| Osage | 0.0 /100 | #316 | Tragic 19.0% |
| Dominicans | 0.0 /100 | #317 | Tragic 19.1% |
| Dutch West Indians | 0.0 /100 | #318 | Tragic 19.2% |
| Slovaks | 0.0 /100 | #319 | Tragic 19.3% |
Demographics Similar to Immigrants from France by Single Father Poverty
In terms of single father poverty, the demographic groups most similar to Immigrants from France are Jordanian (16.1%, a difference of 0.060%), Immigrants from Zimbabwe (16.1%, a difference of 0.060%), Immigrants from Israel (16.1%, a difference of 0.060%), South African (16.1%, a difference of 0.12%), and Mexican (16.1%, a difference of 0.16%).
| Demographics | Rating | Rank | Single Father Poverty |
| Immigrants | Kuwait | 81.4 /100 | #144 | Excellent 16.0% |
| Immigrants | Western Asia | 80.7 /100 | #145 | Excellent 16.0% |
| Immigrants | Hungary | 78.3 /100 | #146 | Good 16.1% |
| Colombians | 77.1 /100 | #147 | Good 16.1% |
| Nigerians | 76.8 /100 | #148 | Good 16.1% |
| South Africans | 75.1 /100 | #149 | Good 16.1% |
| Jordanians | 74.2 /100 | #150 | Good 16.1% |
| Immigrants | France | 73.1 /100 | #151 | Good 16.1% |
| Immigrants | Zimbabwe | 72.1 /100 | #152 | Good 16.1% |
| Immigrants | Israel | 72.0 /100 | #153 | Good 16.1% |
| Mexicans | 70.1 /100 | #154 | Good 16.1% |
| Immigrants | Nicaragua | 67.8 /100 | #155 | Good 16.2% |
| Immigrants | Jordan | 66.0 /100 | #156 | Good 16.2% |
| Immigrants | Czechoslovakia | 62.8 /100 | #157 | Good 16.2% |
| Portuguese | 62.3 /100 | #158 | Good 16.2% |