Guamanian/Chamorro vs Thai Child Poverty Under the Age of 16
COMPARE
Guamanian/Chamorro
Thai
Child Poverty Under the Age of 16
Child Poverty Under the Age of 16 Comparison
Guamanians/Chamorros
Thais
15.9%
CHILD POVERTY UNDER THE AGE OF 16
66.4/ 100
METRIC RATING
165th/ 347
METRIC RANK
11.6%
CHILD POVERTY UNDER THE AGE OF 16
100.0/ 100
METRIC RATING
4th/ 347
METRIC RANK
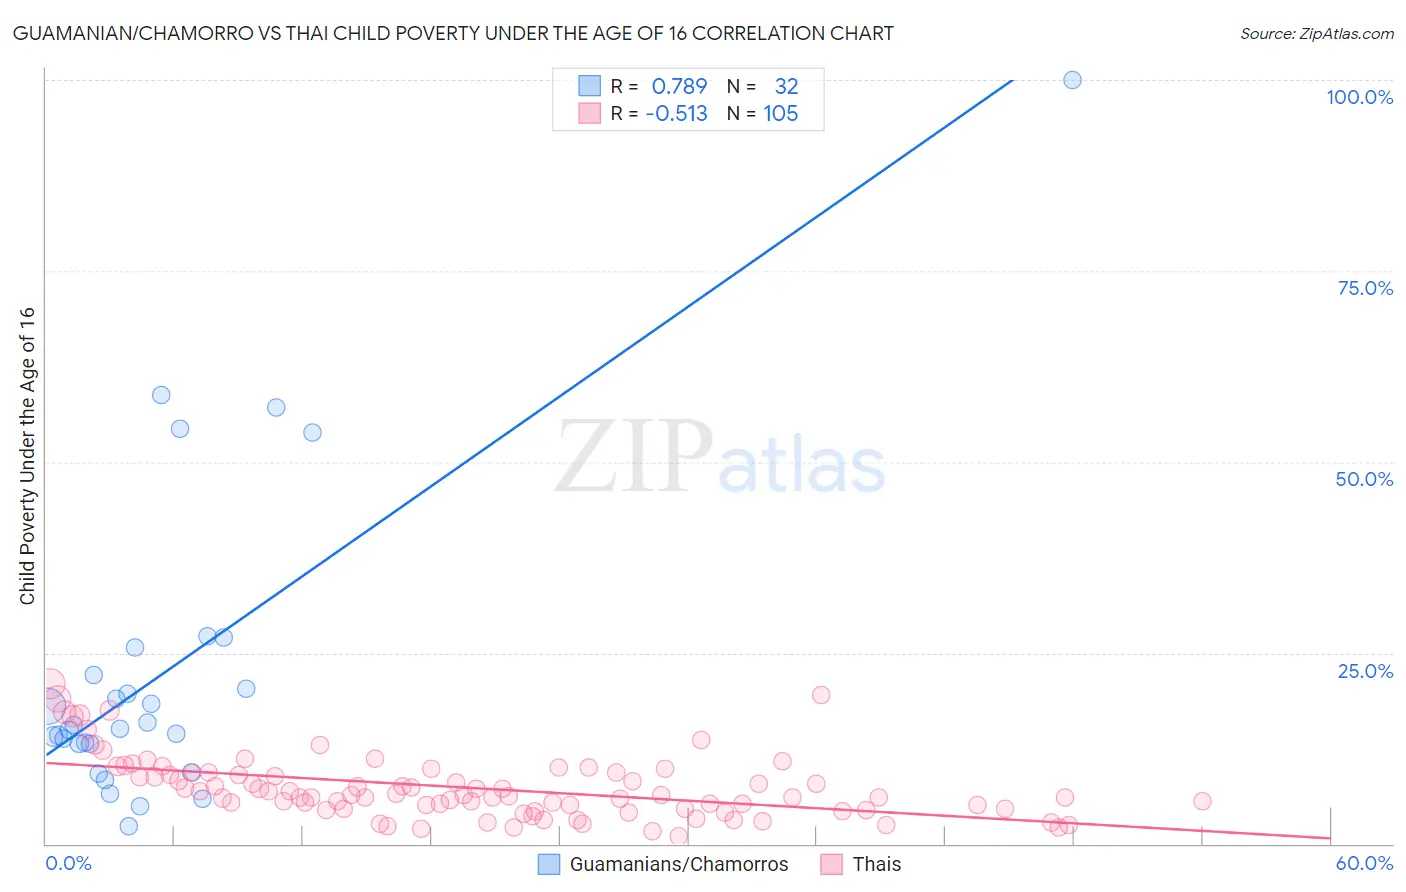
Guamanian/Chamorro vs Thai Child Poverty Under the Age of 16 Correlation Chart
The statistical analysis conducted on geographies consisting of 221,179,374 people shows a strong positive correlation between the proportion of Guamanians/Chamorros and poverty level among children under the age of 16 in the United States with a correlation coefficient (R) of 0.789 and weighted average of 15.9%. Similarly, the statistical analysis conducted on geographies consisting of 469,747,555 people shows a substantial negative correlation between the proportion of Thais and poverty level among children under the age of 16 in the United States with a correlation coefficient (R) of -0.513 and weighted average of 11.6%, a difference of 37.2%.
Child Poverty Under the Age of 16 Correlation Summary
| Measurement | Guamanian/Chamorro | Thai |
| Minimum | 2.2% | 1.0% |
| Maximum | 100.0% | 21.0% |
| Range | 97.8% | 20.0% |
| Mean | 22.7% | 7.3% |
| Median | 15.3% | 6.4% |
| Interquartile 25% (IQ1) | 13.1% | 4.6% |
| Interquartile 75% (IQ3) | 23.9% | 9.3% |
| Interquartile Range (IQR) | 10.7% | 4.7% |
| Standard Deviation (Sample) | 20.6% | 4.1% |
| Standard Deviation (Population) | 20.3% | 4.1% |
Similar Demographics by Child Poverty Under the Age of 16
Demographics Similar to Guamanians/Chamorros by Child Poverty Under the Age of 16
In terms of child poverty under the age of 16, the demographic groups most similar to Guamanians/Chamorros are Immigrants from Germany (15.8%, a difference of 0.13%), Immigrants from Oceania (15.9%, a difference of 0.13%), Colombian (15.8%, a difference of 0.17%), Yugoslavian (15.8%, a difference of 0.17%), and Immigrants from Northern Africa (15.8%, a difference of 0.23%).
| Demographics | Rating | Rank | Child Poverty Under the Age of 16 |
| Immigrants | Chile | 72.8 /100 | #158 | Good 15.7% |
| Immigrants | Fiji | 71.1 /100 | #159 | Good 15.8% |
| Immigrants | Albania | 70.7 /100 | #160 | Good 15.8% |
| Immigrants | Northern Africa | 68.1 /100 | #161 | Good 15.8% |
| Colombians | 67.6 /100 | #162 | Good 15.8% |
| Yugoslavians | 67.6 /100 | #163 | Good 15.8% |
| Immigrants | Germany | 67.3 /100 | #164 | Good 15.8% |
| Guamanians/Chamorros | 66.4 /100 | #165 | Good 15.9% |
| Immigrants | Oceania | 65.4 /100 | #166 | Good 15.9% |
| Costa Ricans | 61.1 /100 | #167 | Good 16.0% |
| South Americans | 57.9 /100 | #168 | Average 16.0% |
| Uruguayans | 54.7 /100 | #169 | Average 16.1% |
| Immigrants | Colombia | 54.4 /100 | #170 | Average 16.1% |
| Hungarians | 52.5 /100 | #171 | Average 16.2% |
| Afghans | 52.3 /100 | #172 | Average 16.2% |
Demographics Similar to Thais by Child Poverty Under the Age of 16
In terms of child poverty under the age of 16, the demographic groups most similar to Thais are Chinese (11.9%, a difference of 3.1%), Filipino (11.1%, a difference of 3.9%), Immigrants from Taiwan (11.0%, a difference of 4.8%), Immigrants from Hong Kong (12.1%, a difference of 5.0%), and Iranian (12.2%, a difference of 5.8%).
| Demographics | Rating | Rank | Child Poverty Under the Age of 16 |
| Immigrants | India | 100.0 /100 | #1 | Exceptional 10.8% |
| Immigrants | Taiwan | 100.0 /100 | #2 | Exceptional 11.0% |
| Filipinos | 100.0 /100 | #3 | Exceptional 11.1% |
| Thais | 100.0 /100 | #4 | Exceptional 11.6% |
| Chinese | 100.0 /100 | #5 | Exceptional 11.9% |
| Immigrants | Hong Kong | 100.0 /100 | #6 | Exceptional 12.1% |
| Iranians | 100.0 /100 | #7 | Exceptional 12.2% |
| Immigrants | Singapore | 100.0 /100 | #8 | Exceptional 12.4% |
| Immigrants | Iran | 100.0 /100 | #9 | Exceptional 12.4% |
| Immigrants | South Central Asia | 99.9 /100 | #10 | Exceptional 12.5% |
| Bhutanese | 99.9 /100 | #11 | Exceptional 12.5% |
| Immigrants | Ireland | 99.9 /100 | #12 | Exceptional 12.7% |
| Burmese | 99.9 /100 | #13 | Exceptional 12.8% |
| Immigrants | Lithuania | 99.9 /100 | #14 | Exceptional 12.9% |
| Immigrants | Korea | 99.9 /100 | #15 | Exceptional 13.0% |