Immigrants from Cuba vs Immigrants from Guyana Child Poverty Under the Age of 16
COMPARE
Immigrants from Cuba
Immigrants from Guyana
Child Poverty Under the Age of 16
Child Poverty Under the Age of 16 Comparison
Immigrants from Cuba
Immigrants from Guyana
18.7%
CHILD POVERTY UNDER THE AGE OF 16
0.6/ 100
METRIC RATING
243rd/ 347
METRIC RANK
19.4%
CHILD POVERTY UNDER THE AGE OF 16
0.1/ 100
METRIC RATING
262nd/ 347
METRIC RANK
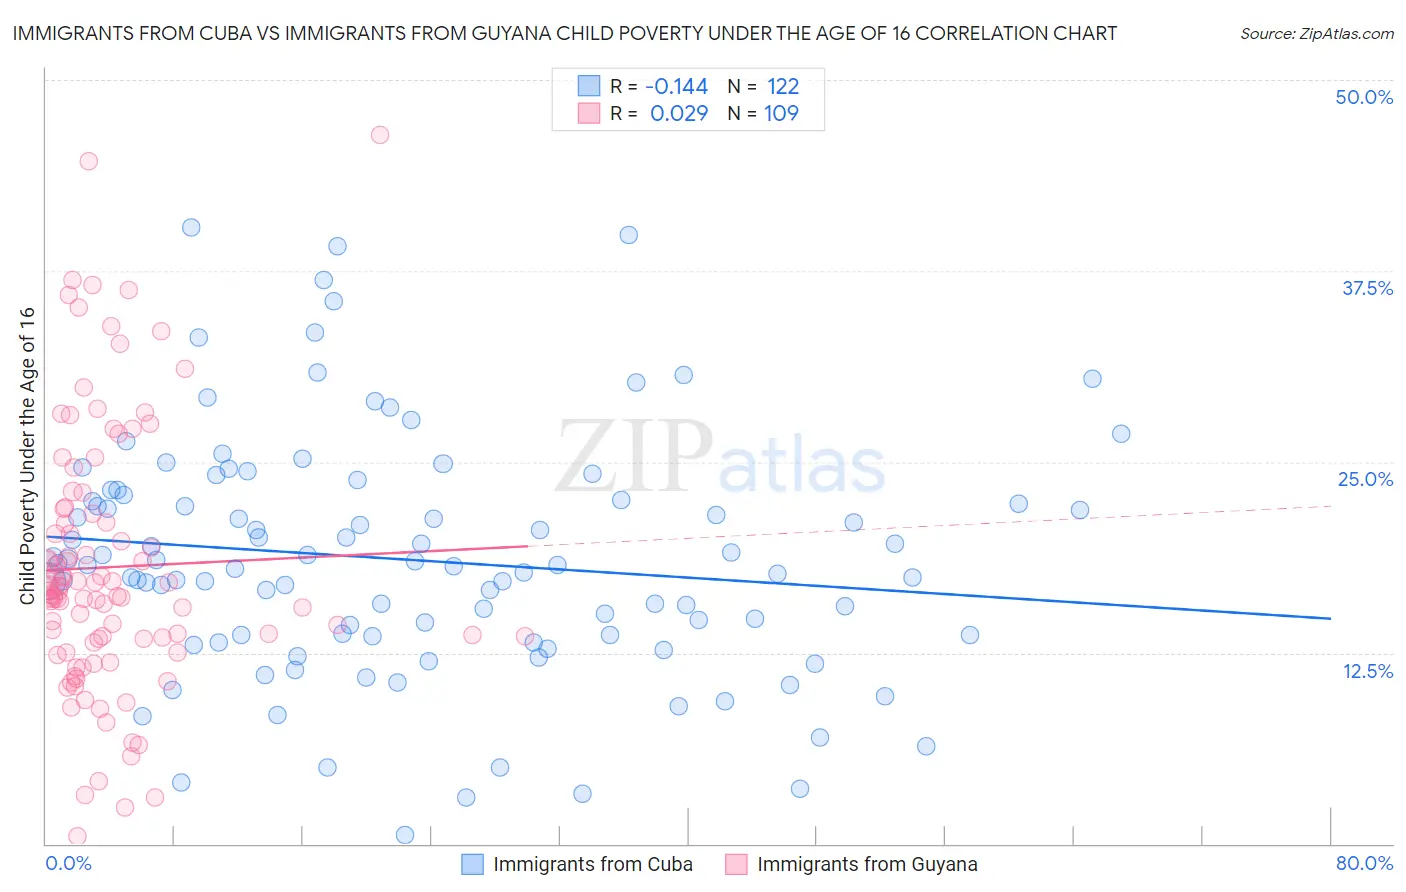
Immigrants from Cuba vs Immigrants from Guyana Child Poverty Under the Age of 16 Correlation Chart
The statistical analysis conducted on geographies consisting of 323,831,024 people shows a poor negative correlation between the proportion of Immigrants from Cuba and poverty level among children under the age of 16 in the United States with a correlation coefficient (R) of -0.144 and weighted average of 18.7%. Similarly, the statistical analysis conducted on geographies consisting of 182,901,367 people shows no correlation between the proportion of Immigrants from Guyana and poverty level among children under the age of 16 in the United States with a correlation coefficient (R) of 0.029 and weighted average of 19.4%, a difference of 3.7%.
Child Poverty Under the Age of 16 Correlation Summary
| Measurement | Immigrants from Cuba | Immigrants from Guyana |
| Minimum | 0.61% | 0.46% |
| Maximum | 40.4% | 46.4% |
| Range | 39.8% | 45.9% |
| Mean | 18.6% | 18.1% |
| Median | 18.2% | 16.5% |
| Interquartile 25% (IQ1) | 13.6% | 13.3% |
| Interquartile 75% (IQ3) | 22.5% | 21.7% |
| Interquartile Range (IQR) | 8.9% | 8.5% |
| Standard Deviation (Sample) | 7.8% | 8.7% |
| Standard Deviation (Population) | 7.8% | 8.6% |
Demographics Similar to Immigrants from Cuba and Immigrants from Guyana by Child Poverty Under the Age of 16
In terms of child poverty under the age of 16, the demographic groups most similar to Immigrants from Cuba are Cape Verdean (18.7%, a difference of 0.070%), Immigrants from Laos (18.7%, a difference of 0.13%), Shoshone (18.8%, a difference of 0.72%), Immigrants from Nicaragua (18.8%, a difference of 0.75%), and French American Indian (18.9%, a difference of 1.0%). Similarly, the demographic groups most similar to Immigrants from Guyana are Immigrants from Burma/Myanmar (19.4%, a difference of 0.040%), Guyanese (19.3%, a difference of 0.12%), Mexican American Indian (19.3%, a difference of 0.22%), Spanish American (19.2%, a difference of 0.77%), and Ottawa (19.2%, a difference of 0.85%).
| Demographics | Rating | Rank | Child Poverty Under the Age of 16 |
| Immigrants | Laos | 0.6 /100 | #242 | Tragic 18.7% |
| Immigrants | Cuba | 0.6 /100 | #243 | Tragic 18.7% |
| Cape Verdeans | 0.6 /100 | #244 | Tragic 18.7% |
| Shoshone | 0.5 /100 | #245 | Tragic 18.8% |
| Immigrants | Nicaragua | 0.4 /100 | #246 | Tragic 18.8% |
| French American Indians | 0.4 /100 | #247 | Tragic 18.9% |
| Ecuadorians | 0.3 /100 | #248 | Tragic 19.0% |
| Potawatomi | 0.3 /100 | #249 | Tragic 19.0% |
| Immigrants | Middle Africa | 0.3 /100 | #250 | Tragic 19.0% |
| Immigrants | Ghana | 0.3 /100 | #251 | Tragic 19.1% |
| Immigrants | Trinidad and Tobago | 0.3 /100 | #252 | Tragic 19.1% |
| Salvadorans | 0.3 /100 | #253 | Tragic 19.1% |
| Immigrants | Western Africa | 0.2 /100 | #254 | Tragic 19.2% |
| Trinidadians and Tobagonians | 0.2 /100 | #255 | Tragic 19.2% |
| Inupiat | 0.2 /100 | #256 | Tragic 19.2% |
| Ottawa | 0.2 /100 | #257 | Tragic 19.2% |
| Spanish Americans | 0.2 /100 | #258 | Tragic 19.2% |
| Mexican American Indians | 0.2 /100 | #259 | Tragic 19.3% |
| Guyanese | 0.2 /100 | #260 | Tragic 19.3% |
| Immigrants | Burma/Myanmar | 0.1 /100 | #261 | Tragic 19.4% |
| Immigrants | Guyana | 0.1 /100 | #262 | Tragic 19.4% |