Immigrants from Cuba vs Immigrants from Haiti Child Poverty Under the Age of 16
COMPARE
Immigrants from Cuba
Immigrants from Haiti
Child Poverty Under the Age of 16
Child Poverty Under the Age of 16 Comparison
Immigrants from Cuba
Immigrants from Haiti
18.7%
CHILD POVERTY UNDER THE AGE OF 16
0.6/ 100
METRIC RATING
243rd/ 347
METRIC RANK
20.9%
CHILD POVERTY UNDER THE AGE OF 16
0.0/ 100
METRIC RATING
299th/ 347
METRIC RANK
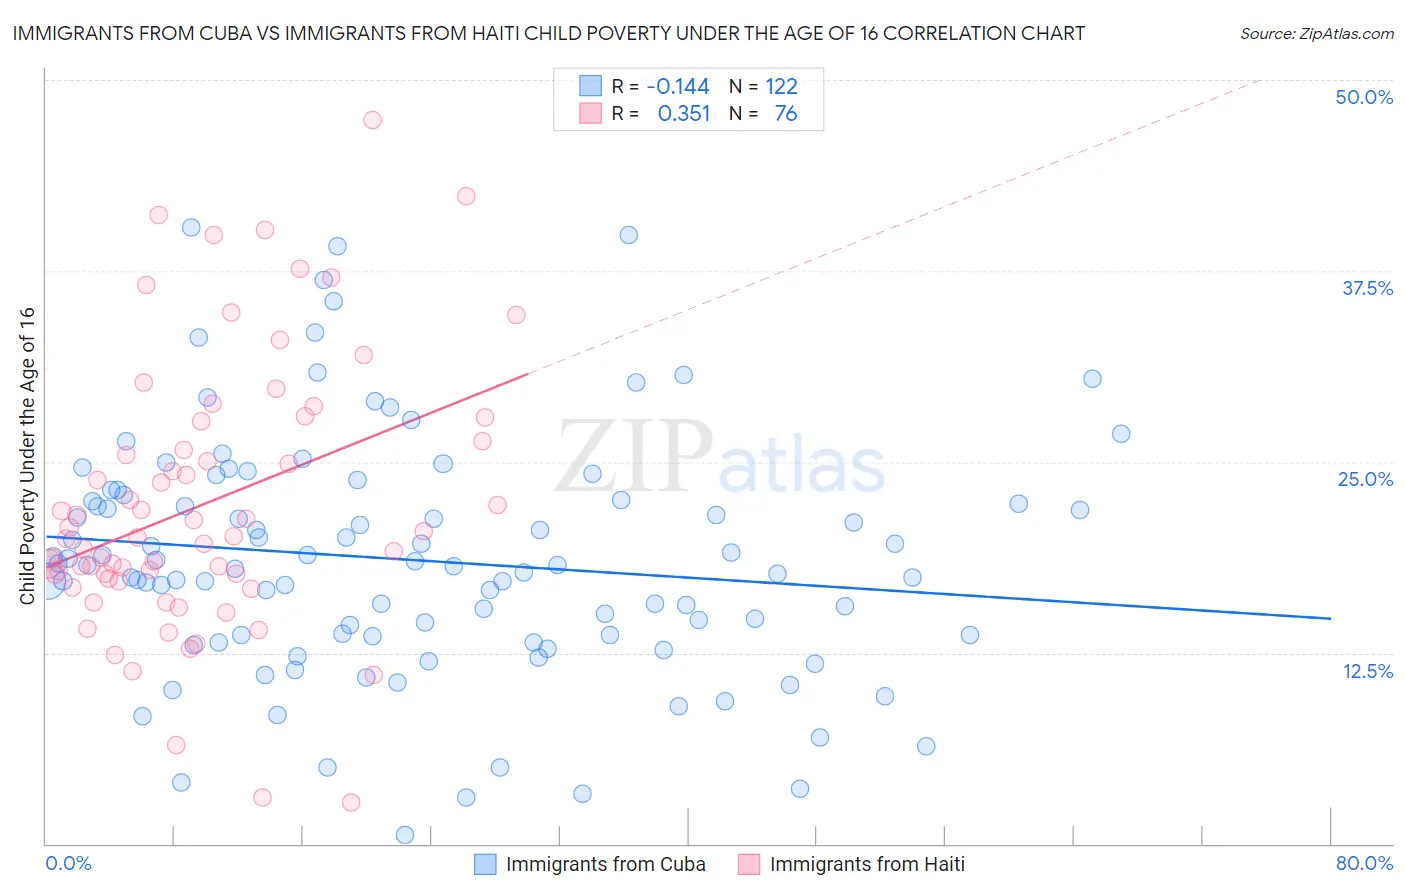
Immigrants from Cuba vs Immigrants from Haiti Child Poverty Under the Age of 16 Correlation Chart
The statistical analysis conducted on geographies consisting of 323,831,024 people shows a poor negative correlation between the proportion of Immigrants from Cuba and poverty level among children under the age of 16 in the United States with a correlation coefficient (R) of -0.144 and weighted average of 18.7%. Similarly, the statistical analysis conducted on geographies consisting of 224,047,921 people shows a mild positive correlation between the proportion of Immigrants from Haiti and poverty level among children under the age of 16 in the United States with a correlation coefficient (R) of 0.351 and weighted average of 20.9%, a difference of 11.6%.
Child Poverty Under the Age of 16 Correlation Summary
| Measurement | Immigrants from Cuba | Immigrants from Haiti |
| Minimum | 0.61% | 2.7% |
| Maximum | 40.4% | 47.4% |
| Range | 39.8% | 44.6% |
| Mean | 18.6% | 22.3% |
| Median | 18.2% | 20.1% |
| Interquartile 25% (IQ1) | 13.6% | 17.5% |
| Interquartile 75% (IQ3) | 22.5% | 27.0% |
| Interquartile Range (IQR) | 8.9% | 9.5% |
| Standard Deviation (Sample) | 7.8% | 8.8% |
| Standard Deviation (Population) | 7.8% | 8.8% |
Similar Demographics by Child Poverty Under the Age of 16
Demographics Similar to Immigrants from Cuba by Child Poverty Under the Age of 16
In terms of child poverty under the age of 16, the demographic groups most similar to Immigrants from Cuba are Cape Verdean (18.7%, a difference of 0.070%), Immigrants from Laos (18.7%, a difference of 0.13%), Alsatian (18.6%, a difference of 0.25%), Ghanaian (18.6%, a difference of 0.71%), and Shoshone (18.8%, a difference of 0.72%).
| Demographics | Rating | Rank | Child Poverty Under the Age of 16 |
| Cree | 0.9 /100 | #236 | Tragic 18.5% |
| Sudanese | 0.9 /100 | #237 | Tragic 18.5% |
| Immigrants | Eritrea | 0.8 /100 | #238 | Tragic 18.5% |
| Immigrants | Sudan | 0.8 /100 | #239 | Tragic 18.5% |
| Ghanaians | 0.8 /100 | #240 | Tragic 18.6% |
| Alsatians | 0.7 /100 | #241 | Tragic 18.6% |
| Immigrants | Laos | 0.6 /100 | #242 | Tragic 18.7% |
| Immigrants | Cuba | 0.6 /100 | #243 | Tragic 18.7% |
| Cape Verdeans | 0.6 /100 | #244 | Tragic 18.7% |
| Shoshone | 0.5 /100 | #245 | Tragic 18.8% |
| Immigrants | Nicaragua | 0.4 /100 | #246 | Tragic 18.8% |
| French American Indians | 0.4 /100 | #247 | Tragic 18.9% |
| Ecuadorians | 0.3 /100 | #248 | Tragic 19.0% |
| Potawatomi | 0.3 /100 | #249 | Tragic 19.0% |
| Immigrants | Middle Africa | 0.3 /100 | #250 | Tragic 19.0% |
Demographics Similar to Immigrants from Haiti by Child Poverty Under the Age of 16
In terms of child poverty under the age of 16, the demographic groups most similar to Immigrants from Haiti are Arapaho (20.8%, a difference of 0.30%), Hispanic or Latino (20.8%, a difference of 0.31%), Immigrants from Caribbean (20.8%, a difference of 0.43%), Indonesian (21.0%, a difference of 0.49%), and Immigrants from Grenada (21.0%, a difference of 0.54%).
| Demographics | Rating | Rank | Child Poverty Under the Age of 16 |
| Immigrants | Latin America | 0.0 /100 | #292 | Tragic 20.5% |
| Immigrants | Senegal | 0.0 /100 | #293 | Tragic 20.6% |
| Haitians | 0.0 /100 | #294 | Tragic 20.7% |
| Mexicans | 0.0 /100 | #295 | Tragic 20.7% |
| Immigrants | Caribbean | 0.0 /100 | #296 | Tragic 20.8% |
| Hispanics or Latinos | 0.0 /100 | #297 | Tragic 20.8% |
| Arapaho | 0.0 /100 | #298 | Tragic 20.8% |
| Immigrants | Haiti | 0.0 /100 | #299 | Tragic 20.9% |
| Indonesians | 0.0 /100 | #300 | Tragic 21.0% |
| Immigrants | Grenada | 0.0 /100 | #301 | Tragic 21.0% |
| Immigrants | Bahamas | 0.0 /100 | #302 | Tragic 21.0% |
| Choctaw | 0.0 /100 | #303 | Tragic 21.0% |
| Somalis | 0.0 /100 | #304 | Tragic 21.0% |
| Seminole | 0.0 /100 | #305 | Tragic 21.1% |
| Guatemalans | 0.0 /100 | #306 | Tragic 21.2% |