Immigrants from Croatia vs Israeli Householder Income Ages 25 - 44 years
COMPARE
Immigrants from Croatia
Israeli
Householder Income Ages 25 - 44 years
Householder Income Ages 25 - 44 years Comparison
Immigrants from Croatia
Israelis
$104,503
HOUSEHOLDER INCOME AGES 25 - 44 YEARS
99.6/ 100
METRIC RATING
70th/ 347
METRIC RANK
$107,579
HOUSEHOLDER INCOME AGES 25 - 44 YEARS
99.9/ 100
METRIC RATING
45th/ 347
METRIC RANK
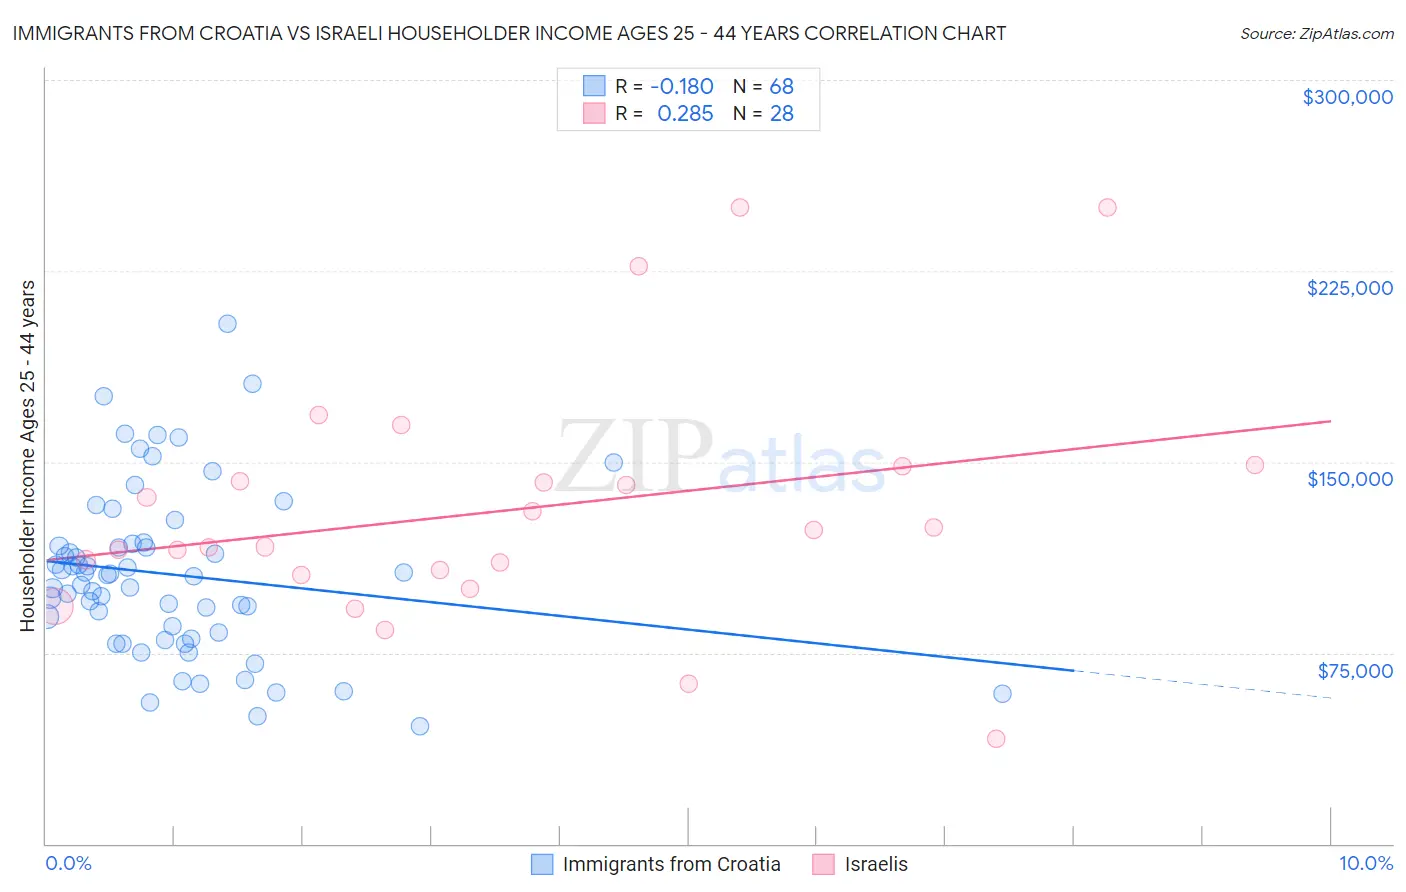
Immigrants from Croatia vs Israeli Householder Income Ages 25 - 44 years Correlation Chart
The statistical analysis conducted on geographies consisting of 132,471,786 people shows a poor negative correlation between the proportion of Immigrants from Croatia and household income with householder between the ages 25 and 44 in the United States with a correlation coefficient (R) of -0.180 and weighted average of $104,503. Similarly, the statistical analysis conducted on geographies consisting of 210,632,541 people shows a weak positive correlation between the proportion of Israelis and household income with householder between the ages 25 and 44 in the United States with a correlation coefficient (R) of 0.285 and weighted average of $107,579, a difference of 2.9%.
Householder Income Ages 25 - 44 years Correlation Summary
| Measurement | Immigrants from Croatia | Israeli |
| Minimum | $46,094 | $41,080 |
| Maximum | $204,358 | $250,001 |
| Range | $158,264 | $208,921 |
| Mean | $105,655 | $131,021 |
| Median | $105,430 | $119,912 |
| Interquartile 25% (IQ1) | $81,770 | $106,515 |
| Interquartile 75% (IQ3) | $117,378 | $145,332 |
| Interquartile Range (IQR) | $35,608 | $38,818 |
| Standard Deviation (Sample) | $32,858 | $48,252 |
| Standard Deviation (Population) | $32,615 | $47,383 |
Similar Demographics by Householder Income Ages 25 - 44 years
Demographics Similar to Immigrants from Croatia by Householder Income Ages 25 - 44 years
In terms of householder income ages 25 - 44 years, the demographic groups most similar to Immigrants from Croatia are Mongolian ($104,578, a difference of 0.070%), Afghan ($104,410, a difference of 0.090%), Immigrants from Eastern Europe ($104,662, a difference of 0.15%), Immigrants from Romania ($104,713, a difference of 0.20%), and Chinese ($104,264, a difference of 0.23%).
| Demographics | Rating | Rank | Householder Income Ages 25 - 44 years |
| Immigrants | Scotland | 99.7 /100 | #63 | Exceptional $105,089 |
| New Zealanders | 99.7 /100 | #64 | Exceptional $105,085 |
| Immigrants | Netherlands | 99.7 /100 | #65 | Exceptional $105,082 |
| Laotians | 99.7 /100 | #66 | Exceptional $104,993 |
| Immigrants | Romania | 99.6 /100 | #67 | Exceptional $104,713 |
| Immigrants | Eastern Europe | 99.6 /100 | #68 | Exceptional $104,662 |
| Mongolians | 99.6 /100 | #69 | Exceptional $104,578 |
| Immigrants | Croatia | 99.6 /100 | #70 | Exceptional $104,503 |
| Afghans | 99.6 /100 | #71 | Exceptional $104,410 |
| Chinese | 99.5 /100 | #72 | Exceptional $104,264 |
| Italians | 99.5 /100 | #73 | Exceptional $104,215 |
| Immigrants | Fiji | 99.5 /100 | #74 | Exceptional $103,954 |
| Koreans | 99.4 /100 | #75 | Exceptional $103,824 |
| Immigrants | Spain | 99.4 /100 | #76 | Exceptional $103,752 |
| Immigrants | Southern Europe | 99.3 /100 | #77 | Exceptional $103,486 |
Demographics Similar to Israelis by Householder Income Ages 25 - 44 years
In terms of householder income ages 25 - 44 years, the demographic groups most similar to Israelis are Immigrants from Indonesia ($107,627, a difference of 0.040%), Immigrants from Malaysia ($107,650, a difference of 0.070%), Immigrants from Belarus ($107,393, a difference of 0.17%), Estonian ($107,269, a difference of 0.29%), and Bulgarian ($107,264, a difference of 0.29%).
| Demographics | Rating | Rank | Householder Income Ages 25 - 44 years |
| Soviet Union | 100.0 /100 | #38 | Exceptional $108,457 |
| Immigrants | France | 99.9 /100 | #39 | Exceptional $108,257 |
| Immigrants | Lithuania | 99.9 /100 | #40 | Exceptional $108,149 |
| Immigrants | Bolivia | 99.9 /100 | #41 | Exceptional $108,128 |
| Australians | 99.9 /100 | #42 | Exceptional $107,912 |
| Immigrants | Malaysia | 99.9 /100 | #43 | Exceptional $107,650 |
| Immigrants | Indonesia | 99.9 /100 | #44 | Exceptional $107,627 |
| Israelis | 99.9 /100 | #45 | Exceptional $107,579 |
| Immigrants | Belarus | 99.9 /100 | #46 | Exceptional $107,393 |
| Estonians | 99.9 /100 | #47 | Exceptional $107,269 |
| Bulgarians | 99.9 /100 | #48 | Exceptional $107,264 |
| Immigrants | Turkey | 99.9 /100 | #49 | Exceptional $107,258 |
| Cambodians | 99.9 /100 | #50 | Exceptional $107,148 |
| Immigrants | Czechoslovakia | 99.9 /100 | #51 | Exceptional $106,888 |
| Immigrants | Europe | 99.9 /100 | #52 | Exceptional $106,817 |