Immigrants from Croatia vs Iroquois Male Disability
COMPARE
Immigrants from Croatia
Iroquois
Male Disability
Male Disability Comparison
Immigrants from Croatia
Iroquois
11.0%
MALE DISABILITY
77.3/ 100
METRIC RATING
147th/ 347
METRIC RANK
13.6%
MALE DISABILITY
0.0/ 100
METRIC RATING
315th/ 347
METRIC RANK
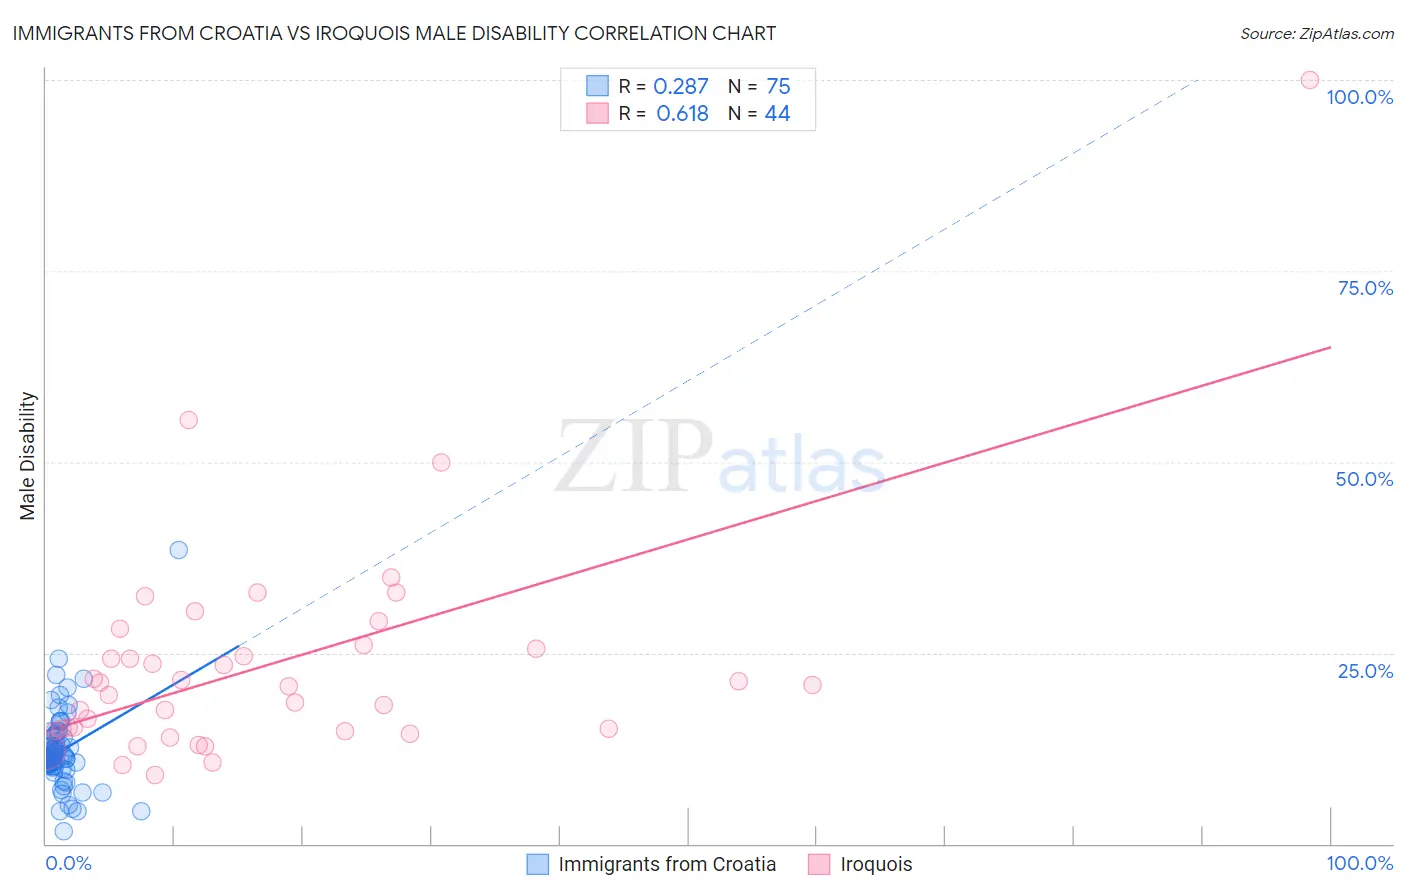
Immigrants from Croatia vs Iroquois Male Disability Correlation Chart
The statistical analysis conducted on geographies consisting of 132,571,821 people shows a weak positive correlation between the proportion of Immigrants from Croatia and percentage of males with a disability in the United States with a correlation coefficient (R) of 0.287 and weighted average of 11.0%. Similarly, the statistical analysis conducted on geographies consisting of 207,273,711 people shows a significant positive correlation between the proportion of Iroquois and percentage of males with a disability in the United States with a correlation coefficient (R) of 0.618 and weighted average of 13.6%, a difference of 23.1%.
Male Disability Correlation Summary
| Measurement | Immigrants from Croatia | Iroquois |
| Minimum | 1.6% | 9.0% |
| Maximum | 38.5% | 100.0% |
| Range | 36.9% | 91.0% |
| Mean | 12.2% | 23.4% |
| Median | 11.4% | 20.7% |
| Interquartile 25% (IQ1) | 10.1% | 14.9% |
| Interquartile 75% (IQ3) | 13.9% | 25.8% |
| Interquartile Range (IQR) | 3.8% | 11.0% |
| Standard Deviation (Sample) | 5.2% | 15.2% |
| Standard Deviation (Population) | 5.2% | 15.0% |
Similar Demographics by Male Disability
Demographics Similar to Immigrants from Croatia by Male Disability
In terms of male disability, the demographic groups most similar to Immigrants from Croatia are Sudanese (11.0%, a difference of 0.010%), Korean (11.0%, a difference of 0.020%), Costa Rican (11.0%, a difference of 0.060%), Kenyan (11.0%, a difference of 0.070%), and Immigrants from Denmark (11.0%, a difference of 0.070%).
| Demographics | Rating | Rank | Male Disability |
| Immigrants | Italy | 81.5 /100 | #140 | Excellent 11.0% |
| Arabs | 81.5 /100 | #141 | Excellent 11.0% |
| Immigrants | Sudan | 81.5 /100 | #142 | Excellent 11.0% |
| Moroccans | 80.7 /100 | #143 | Excellent 11.0% |
| Kenyans | 78.1 /100 | #144 | Good 11.0% |
| Costa Ricans | 78.0 /100 | #145 | Good 11.0% |
| Koreans | 77.5 /100 | #146 | Good 11.0% |
| Immigrants | Croatia | 77.3 /100 | #147 | Good 11.0% |
| Sudanese | 77.1 /100 | #148 | Good 11.0% |
| Immigrants | Denmark | 76.4 /100 | #149 | Good 11.0% |
| Immigrants | Guatemala | 75.1 /100 | #150 | Good 11.0% |
| Cubans | 74.9 /100 | #151 | Good 11.0% |
| Immigrants | Albania | 74.4 /100 | #152 | Good 11.0% |
| Immigrants | Northern Europe | 73.2 /100 | #153 | Good 11.1% |
| Immigrants | Moldova | 72.8 /100 | #154 | Good 11.1% |
Demographics Similar to Iroquois by Male Disability
In terms of male disability, the demographic groups most similar to Iroquois are Alaska Native (13.6%, a difference of 0.050%), Aleut (13.5%, a difference of 0.16%), Puget Sound Salish (13.5%, a difference of 0.22%), Yakama (13.5%, a difference of 0.24%), and Delaware (13.5%, a difference of 0.79%).
| Demographics | Rating | Rank | Male Disability |
| French American Indians | 0.0 /100 | #308 | Tragic 13.4% |
| Blackfeet | 0.0 /100 | #309 | Tragic 13.4% |
| Immigrants | Azores | 0.0 /100 | #310 | Tragic 13.4% |
| Delaware | 0.0 /100 | #311 | Tragic 13.5% |
| Yakama | 0.0 /100 | #312 | Tragic 13.5% |
| Puget Sound Salish | 0.0 /100 | #313 | Tragic 13.5% |
| Aleuts | 0.0 /100 | #314 | Tragic 13.5% |
| Iroquois | 0.0 /100 | #315 | Tragic 13.6% |
| Alaska Natives | 0.0 /100 | #316 | Tragic 13.6% |
| Paiute | 0.0 /100 | #317 | Tragic 13.7% |
| Cree | 0.0 /100 | #318 | Tragic 13.7% |
| Americans | 0.0 /100 | #319 | Tragic 13.8% |
| Tlingit-Haida | 0.0 /100 | #320 | Tragic 13.8% |
| Shoshone | 0.0 /100 | #321 | Tragic 13.8% |
| Apache | 0.0 /100 | #322 | Tragic 14.0% |