Ute vs Immigrants from Congo Child Poverty Under the Age of 5
COMPARE
Ute
Immigrants from Congo
Child Poverty Under the Age of 5
Child Poverty Under the Age of 5 Comparison
Ute
Immigrants from Congo
23.5%
CHILD POVERTY UNDER THE AGE OF 5
0.0/ 100
METRIC RATING
322nd/ 347
METRIC RANK
23.9%
CHILD POVERTY UNDER THE AGE OF 5
0.0/ 100
METRIC RATING
325th/ 347
METRIC RANK
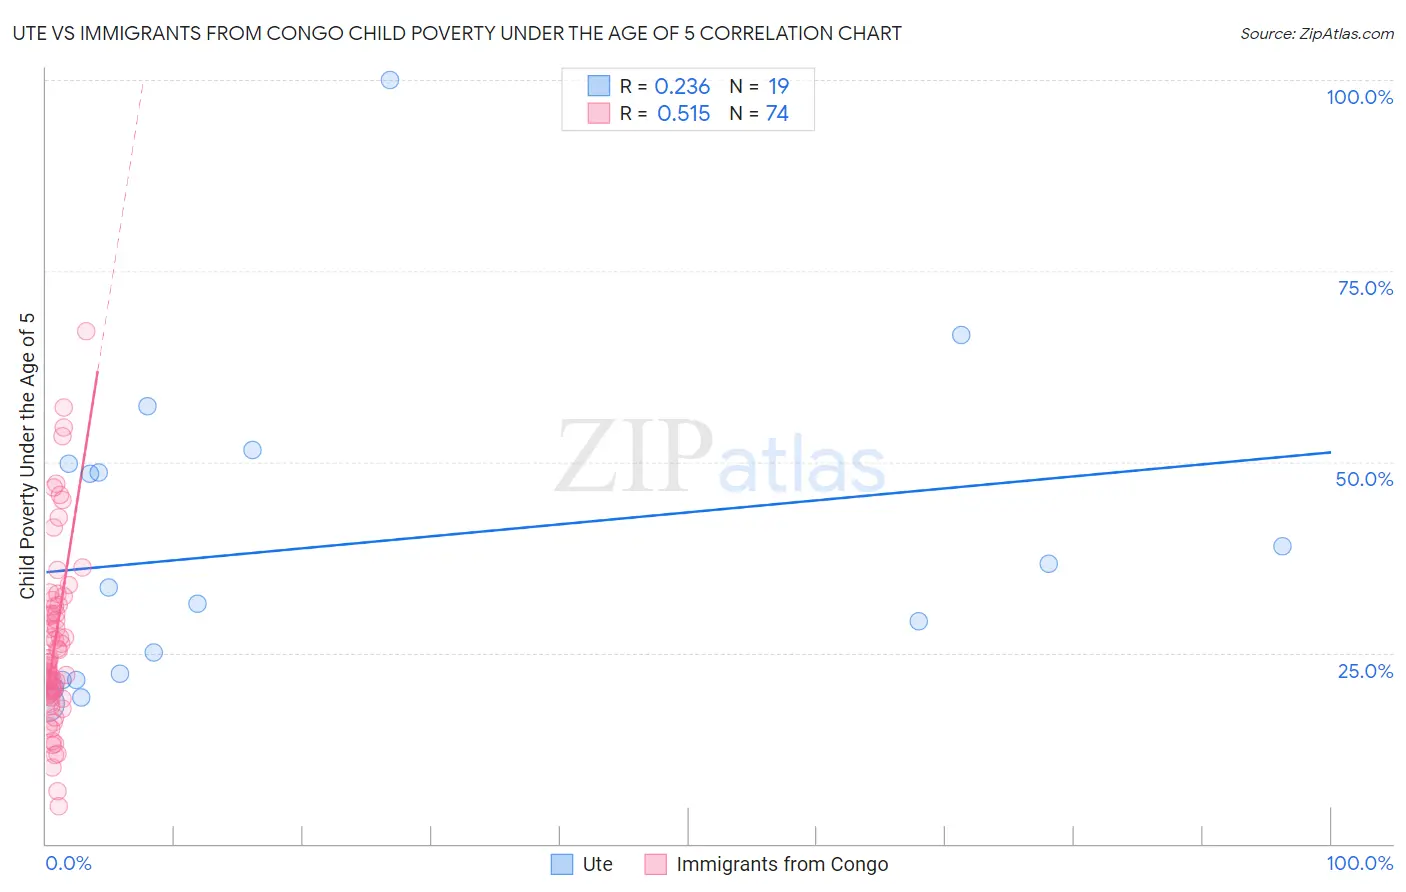
Ute vs Immigrants from Congo Child Poverty Under the Age of 5 Correlation Chart
The statistical analysis conducted on geographies consisting of 55,277,980 people shows a weak positive correlation between the proportion of Ute and poverty level among children under the age of 5 in the United States with a correlation coefficient (R) of 0.236 and weighted average of 23.5%. Similarly, the statistical analysis conducted on geographies consisting of 91,481,308 people shows a substantial positive correlation between the proportion of Immigrants from Congo and poverty level among children under the age of 5 in the United States with a correlation coefficient (R) of 0.515 and weighted average of 23.9%, a difference of 1.4%.
Child Poverty Under the Age of 5 Correlation Summary
| Measurement | Ute | Immigrants from Congo |
| Minimum | 18.4% | 5.0% |
| Maximum | 100.0% | 67.1% |
| Range | 81.6% | 62.1% |
| Mean | 38.9% | 26.4% |
| Median | 33.5% | 23.8% |
| Interquartile 25% (IQ1) | 21.4% | 19.7% |
| Interquartile 75% (IQ3) | 49.7% | 31.1% |
| Interquartile Range (IQR) | 28.3% | 11.4% |
| Standard Deviation (Sample) | 20.7% | 11.8% |
| Standard Deviation (Population) | 20.2% | 11.7% |
Demographics Similar to Ute and Immigrants from Congo by Child Poverty Under the Age of 5
In terms of child poverty under the age of 5, the demographic groups most similar to Ute are Immigrants from Honduras (23.5%, a difference of 0.23%), Choctaw (23.5%, a difference of 0.26%), Pueblo (23.7%, a difference of 0.58%), Chippewa (23.4%, a difference of 0.64%), and Dutch West Indian (23.3%, a difference of 1.1%). Similarly, the demographic groups most similar to Immigrants from Congo are Central American Indian (23.9%, a difference of 0.18%), Paiute (23.8%, a difference of 0.21%), Dominican (24.0%, a difference of 0.64%), Immigrants from Dominican Republic (24.1%, a difference of 0.73%), and Pueblo (23.7%, a difference of 0.82%).
| Demographics | Rating | Rank | Child Poverty Under the Age of 5 |
| Bahamians | 0.0 /100 | #313 | Tragic 23.0% |
| U.S. Virgin Islanders | 0.0 /100 | #314 | Tragic 23.0% |
| Arapaho | 0.0 /100 | #315 | Tragic 23.1% |
| Yakama | 0.0 /100 | #316 | Tragic 23.1% |
| Menominee | 0.0 /100 | #317 | Tragic 23.3% |
| Dutch West Indians | 0.0 /100 | #318 | Tragic 23.3% |
| Chippewa | 0.0 /100 | #319 | Tragic 23.4% |
| Choctaw | 0.0 /100 | #320 | Tragic 23.5% |
| Immigrants | Honduras | 0.0 /100 | #321 | Tragic 23.5% |
| Ute | 0.0 /100 | #322 | Tragic 23.5% |
| Pueblo | 0.0 /100 | #323 | Tragic 23.7% |
| Paiute | 0.0 /100 | #324 | Tragic 23.8% |
| Immigrants | Congo | 0.0 /100 | #325 | Tragic 23.9% |
| Central American Indians | 0.0 /100 | #326 | Tragic 23.9% |
| Dominicans | 0.0 /100 | #327 | Tragic 24.0% |
| Immigrants | Dominican Republic | 0.0 /100 | #328 | Tragic 24.1% |
| Cajuns | 0.0 /100 | #329 | Tragic 24.1% |
| Creek | 0.0 /100 | #330 | Tragic 24.2% |
| Kiowa | 0.0 /100 | #331 | Tragic 24.5% |
| Apache | 0.0 /100 | #332 | Tragic 25.0% |
| Natives/Alaskans | 0.0 /100 | #333 | Tragic 25.6% |