Immigrants from Congo vs Cambodian Poverty
COMPARE
Immigrants from Congo
Cambodian
Poverty
Poverty Comparison
Immigrants from Congo
Cambodians
16.1%
POVERTY
0.0/ 100
METRIC RATING
319th/ 347
METRIC RANK
11.3%
POVERTY
96.7/ 100
METRIC RATING
79th/ 347
METRIC RANK
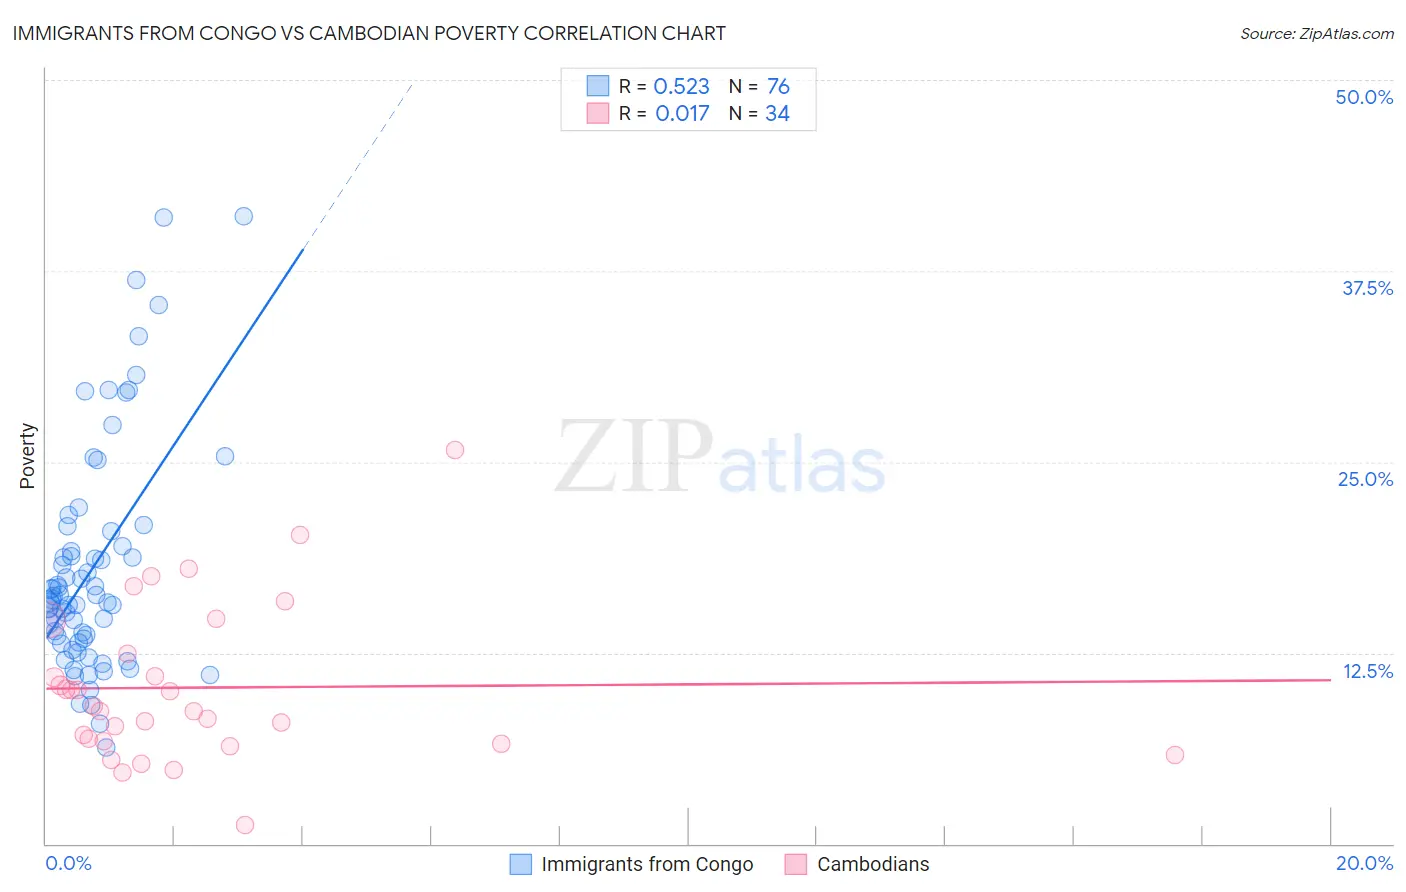
Immigrants from Congo vs Cambodian Poverty Correlation Chart
The statistical analysis conducted on geographies consisting of 92,094,185 people shows a substantial positive correlation between the proportion of Immigrants from Congo and poverty level in the United States with a correlation coefficient (R) of 0.523 and weighted average of 16.1%. Similarly, the statistical analysis conducted on geographies consisting of 102,491,880 people shows no correlation between the proportion of Cambodians and poverty level in the United States with a correlation coefficient (R) of 0.017 and weighted average of 11.3%, a difference of 42.6%.
Poverty Correlation Summary
| Measurement | Immigrants from Congo | Cambodian |
| Minimum | 6.3% | 1.2% |
| Maximum | 41.0% | 25.8% |
| Range | 34.7% | 24.6% |
| Mean | 18.1% | 10.2% |
| Median | 16.1% | 8.8% |
| Interquartile 25% (IQ1) | 13.3% | 6.7% |
| Interquartile 75% (IQ3) | 20.0% | 12.4% |
| Interquartile Range (IQR) | 6.7% | 5.7% |
| Standard Deviation (Sample) | 7.4% | 5.1% |
| Standard Deviation (Population) | 7.4% | 5.1% |
Similar Demographics by Poverty
Demographics Similar to Immigrants from Congo by Poverty
In terms of poverty, the demographic groups most similar to Immigrants from Congo are Immigrants from Dominica (16.1%, a difference of 0.20%), Immigrants from Honduras (16.2%, a difference of 0.23%), U.S. Virgin Islander (16.1%, a difference of 0.49%), Arapaho (16.3%, a difference of 0.97%), and Honduran (15.9%, a difference of 1.7%).
| Demographics | Rating | Rank | Poverty |
| Cajuns | 0.0 /100 | #312 | Tragic 15.7% |
| Immigrants | Grenada | 0.0 /100 | #313 | Tragic 15.8% |
| Immigrants | Somalia | 0.0 /100 | #314 | Tragic 15.8% |
| British West Indians | 0.0 /100 | #315 | Tragic 15.9% |
| Hondurans | 0.0 /100 | #316 | Tragic 15.9% |
| U.S. Virgin Islanders | 0.0 /100 | #317 | Tragic 16.1% |
| Immigrants | Dominica | 0.0 /100 | #318 | Tragic 16.1% |
| Immigrants | Congo | 0.0 /100 | #319 | Tragic 16.1% |
| Immigrants | Honduras | 0.0 /100 | #320 | Tragic 16.2% |
| Arapaho | 0.0 /100 | #321 | Tragic 16.3% |
| Menominee | 0.0 /100 | #322 | Tragic 16.4% |
| Colville | 0.0 /100 | #323 | Tragic 16.6% |
| Yakama | 0.0 /100 | #324 | Tragic 16.7% |
| Central American Indians | 0.0 /100 | #325 | Tragic 16.7% |
| Paiute | 0.0 /100 | #326 | Tragic 16.7% |
Demographics Similar to Cambodians by Poverty
In terms of poverty, the demographic groups most similar to Cambodians are Indian (Asian) (11.3%, a difference of 0.020%), Irish (11.3%, a difference of 0.020%), Dutch (11.3%, a difference of 0.040%), Immigrants from Eastern Asia (11.3%, a difference of 0.060%), and Egyptian (11.3%, a difference of 0.12%).
| Demographics | Rating | Rank | Poverty |
| Europeans | 97.2 /100 | #72 | Exceptional 11.3% |
| Immigrants | Belgium | 97.2 /100 | #73 | Exceptional 11.3% |
| Carpatho Rusyns | 97.2 /100 | #74 | Exceptional 11.3% |
| Immigrants | Eastern Europe | 97.0 /100 | #75 | Exceptional 11.3% |
| Immigrants | North America | 96.8 /100 | #76 | Exceptional 11.3% |
| Immigrants | Eastern Asia | 96.7 /100 | #77 | Exceptional 11.3% |
| Dutch | 96.7 /100 | #78 | Exceptional 11.3% |
| Cambodians | 96.7 /100 | #79 | Exceptional 11.3% |
| Indians (Asian) | 96.6 /100 | #80 | Exceptional 11.3% |
| Irish | 96.6 /100 | #81 | Exceptional 11.3% |
| Egyptians | 96.5 /100 | #82 | Exceptional 11.3% |
| Immigrants | Sweden | 96.3 /100 | #83 | Exceptional 11.3% |
| English | 96.3 /100 | #84 | Exceptional 11.3% |
| Immigrants | England | 96.2 /100 | #85 | Exceptional 11.4% |
| Jordanians | 96.0 /100 | #86 | Exceptional 11.4% |