Immigrants from China vs Spanish American Indian Family Poverty
COMPARE
Immigrants from China
Spanish American Indian
Family Poverty
Family Poverty Comparison
Immigrants from China
Spanish American Indians
7.8%
FAMILY POVERTY
98.1/ 100
METRIC RATING
74th/ 347
METRIC RANK
10.9%
FAMILY POVERTY
0.2/ 100
METRIC RATING
262nd/ 347
METRIC RANK
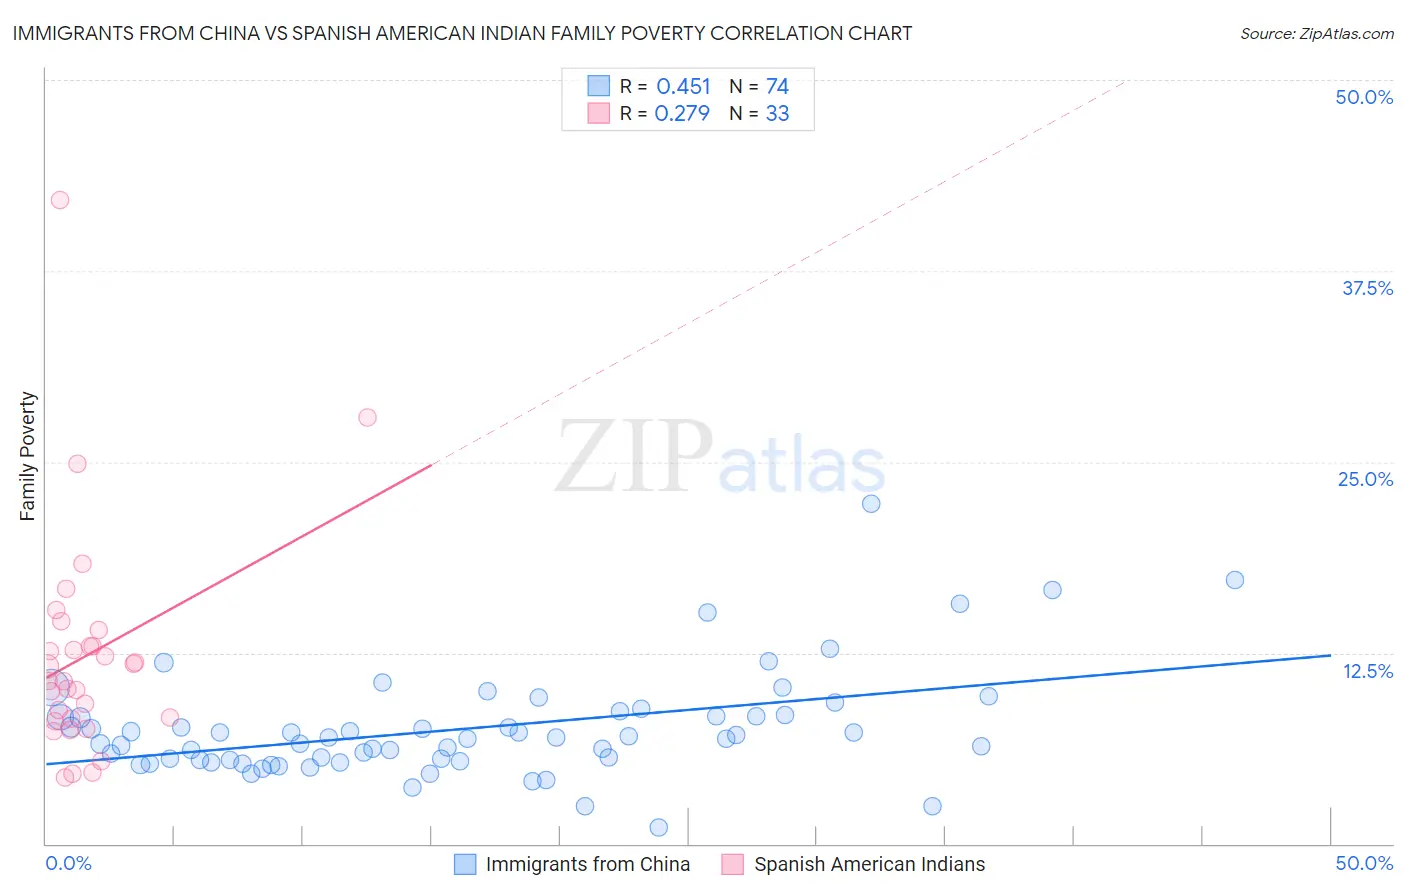
Immigrants from China vs Spanish American Indian Family Poverty Correlation Chart
The statistical analysis conducted on geographies consisting of 454,907,220 people shows a moderate positive correlation between the proportion of Immigrants from China and poverty level among families in the United States with a correlation coefficient (R) of 0.451 and weighted average of 7.8%. Similarly, the statistical analysis conducted on geographies consisting of 73,121,787 people shows a weak positive correlation between the proportion of Spanish American Indians and poverty level among families in the United States with a correlation coefficient (R) of 0.279 and weighted average of 10.9%, a difference of 39.3%.
Family Poverty Correlation Summary
| Measurement | Immigrants from China | Spanish American Indian |
| Minimum | 1.0% | 4.4% |
| Maximum | 22.2% | 42.1% |
| Range | 21.2% | 37.8% |
| Mean | 7.5% | 12.4% |
| Median | 6.9% | 10.7% |
| Interquartile 25% (IQ1) | 5.5% | 8.1% |
| Interquartile 75% (IQ3) | 8.4% | 13.5% |
| Interquartile Range (IQR) | 2.9% | 5.4% |
| Standard Deviation (Sample) | 3.5% | 7.4% |
| Standard Deviation (Population) | 3.4% | 7.3% |
Similar Demographics by Family Poverty
Demographics Similar to Immigrants from China by Family Poverty
In terms of family poverty, the demographic groups most similar to Immigrants from China are Austrian (7.8%, a difference of 0.070%), Immigrants from Romania (7.8%, a difference of 0.080%), Cambodian (7.8%, a difference of 0.14%), Immigrants from Croatia (7.8%, a difference of 0.14%), and Immigrants from Canada (7.8%, a difference of 0.16%).
| Demographics | Rating | Rank | Family Poverty |
| Northern Europeans | 98.3 /100 | #67 | Exceptional 7.8% |
| Australians | 98.2 /100 | #68 | Exceptional 7.8% |
| Immigrants | Belgium | 98.2 /100 | #69 | Exceptional 7.8% |
| Immigrants | Canada | 98.2 /100 | #70 | Exceptional 7.8% |
| Cambodians | 98.2 /100 | #71 | Exceptional 7.8% |
| Immigrants | Romania | 98.2 /100 | #72 | Exceptional 7.8% |
| Austrians | 98.2 /100 | #73 | Exceptional 7.8% |
| Immigrants | China | 98.1 /100 | #74 | Exceptional 7.8% |
| Immigrants | Croatia | 98.1 /100 | #75 | Exceptional 7.8% |
| Immigrants | Latvia | 98.0 /100 | #76 | Exceptional 7.9% |
| Ukrainians | 98.0 /100 | #77 | Exceptional 7.9% |
| Immigrants | North America | 97.9 /100 | #78 | Exceptional 7.9% |
| Immigrants | Europe | 97.8 /100 | #79 | Exceptional 7.9% |
| English | 97.8 /100 | #80 | Exceptional 7.9% |
| Irish | 97.8 /100 | #81 | Exceptional 7.9% |
Demographics Similar to Spanish American Indians by Family Poverty
In terms of family poverty, the demographic groups most similar to Spanish American Indians are Shoshone (10.9%, a difference of 0.13%), Bangladeshi (10.9%, a difference of 0.17%), Cape Verdean (10.9%, a difference of 0.26%), Trinidadian and Tobagonian (10.9%, a difference of 0.28%), and Immigrants from Trinidad and Tobago (10.9%, a difference of 0.33%).
| Demographics | Rating | Rank | Family Poverty |
| Immigrants | Liberia | 0.2 /100 | #255 | Tragic 10.8% |
| Chickasaw | 0.2 /100 | #256 | Tragic 10.8% |
| Immigrants | Ghana | 0.2 /100 | #257 | Tragic 10.8% |
| Sub-Saharan Africans | 0.2 /100 | #258 | Tragic 10.9% |
| Mexican American Indians | 0.2 /100 | #259 | Tragic 10.9% |
| Bangladeshis | 0.2 /100 | #260 | Tragic 10.9% |
| Shoshone | 0.2 /100 | #261 | Tragic 10.9% |
| Spanish American Indians | 0.2 /100 | #262 | Tragic 10.9% |
| Cape Verdeans | 0.1 /100 | #263 | Tragic 10.9% |
| Trinidadians and Tobagonians | 0.1 /100 | #264 | Tragic 10.9% |
| Immigrants | Trinidad and Tobago | 0.1 /100 | #265 | Tragic 10.9% |
| Immigrants | El Salvador | 0.1 /100 | #266 | Tragic 11.0% |
| Comanche | 0.1 /100 | #267 | Tragic 11.0% |
| Jamaicans | 0.1 /100 | #268 | Tragic 11.1% |
| Immigrants | Ecuador | 0.1 /100 | #269 | Tragic 11.1% |