Immigrants from Chile vs Immigrants from Southern Europe Child Poverty Among Girls Under 16
COMPARE
Immigrants from Chile
Immigrants from Southern Europe
Child Poverty Among Girls Under 16
Child Poverty Among Girls Under 16 Comparison
Immigrants from Chile
Immigrants from Southern Europe
15.9%
CHILD POVERTY AMONG GIRLS UNDER 16
76.7/ 100
METRIC RATING
154th/ 347
METRIC RANK
15.3%
CHILD POVERTY AMONG GIRLS UNDER 16
92.7/ 100
METRIC RATING
118th/ 347
METRIC RANK
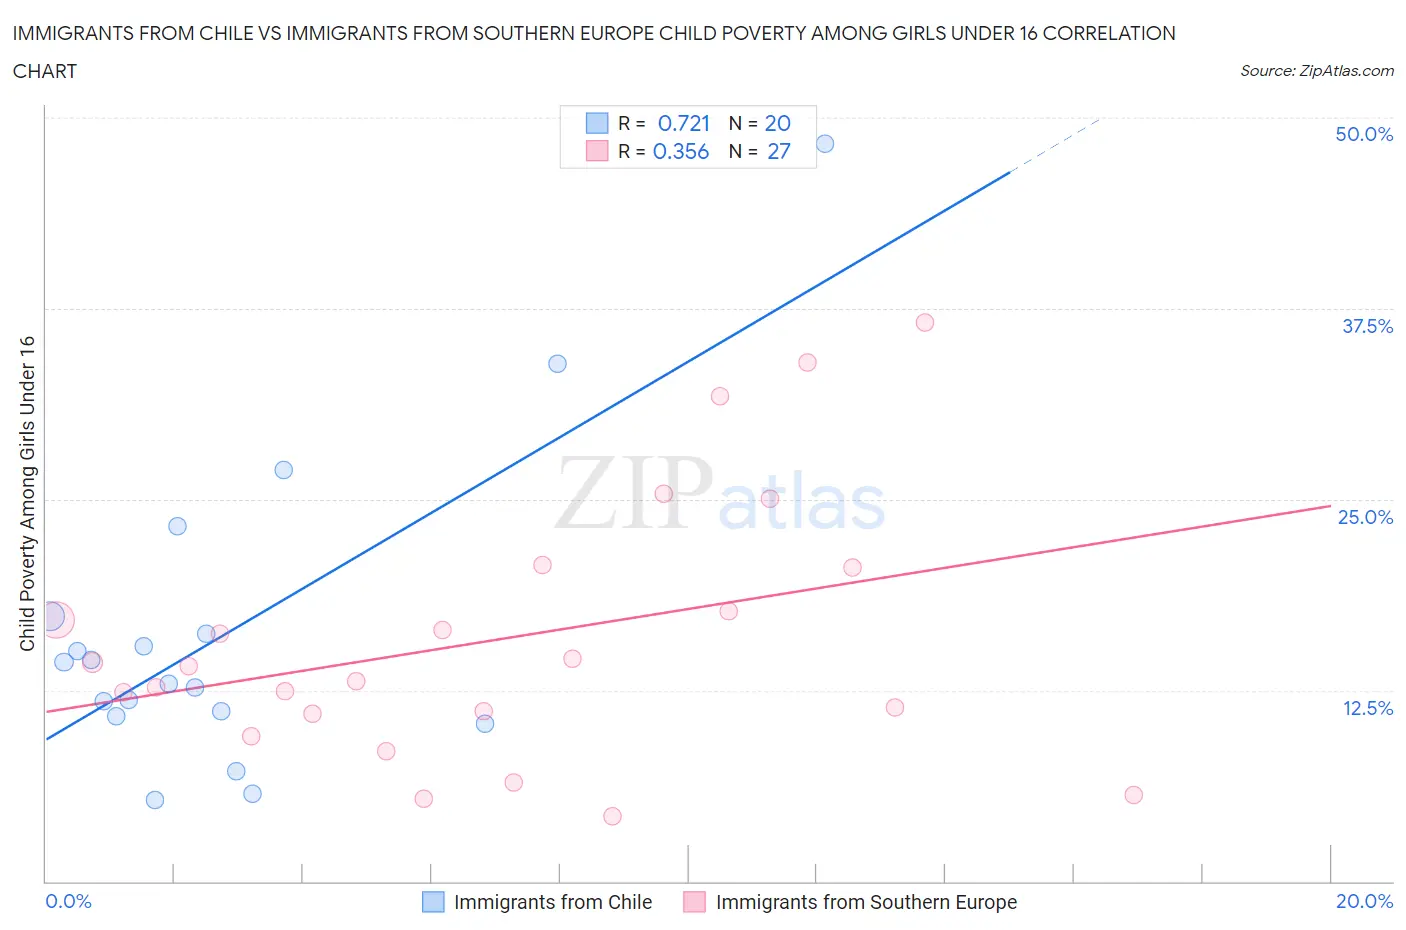
Immigrants from Chile vs Immigrants from Southern Europe Child Poverty Among Girls Under 16 Correlation Chart
The statistical analysis conducted on geographies consisting of 216,642,193 people shows a strong positive correlation between the proportion of Immigrants from Chile and poverty level among girls under the age of 16 in the United States with a correlation coefficient (R) of 0.721 and weighted average of 15.9%. Similarly, the statistical analysis conducted on geographies consisting of 393,086,962 people shows a mild positive correlation between the proportion of Immigrants from Southern Europe and poverty level among girls under the age of 16 in the United States with a correlation coefficient (R) of 0.356 and weighted average of 15.3%, a difference of 4.2%.
Child Poverty Among Girls Under 16 Correlation Summary
| Measurement | Immigrants from Chile | Immigrants from Southern Europe |
| Minimum | 5.3% | 4.3% |
| Maximum | 48.3% | 36.6% |
| Range | 43.0% | 32.4% |
| Mean | 16.2% | 15.9% |
| Median | 13.6% | 14.1% |
| Interquartile 25% (IQ1) | 10.9% | 11.0% |
| Interquartile 75% (IQ3) | 16.7% | 20.6% |
| Interquartile Range (IQR) | 5.8% | 9.6% |
| Standard Deviation (Sample) | 10.2% | 8.5% |
| Standard Deviation (Population) | 9.9% | 8.4% |
Similar Demographics by Child Poverty Among Girls Under 16
Demographics Similar to Immigrants from Chile by Child Poverty Among Girls Under 16
In terms of child poverty among girls under 16, the demographic groups most similar to Immigrants from Chile are Syrian (15.9%, a difference of 0.010%), Immigrants from Fiji (15.9%, a difference of 0.11%), Colombian (15.9%, a difference of 0.11%), Guamanian/Chamorro (15.9%, a difference of 0.23%), and Slovak (15.9%, a difference of 0.24%).
| Demographics | Rating | Rank | Child Poverty Among Girls Under 16 |
| Slavs | 83.1 /100 | #147 | Excellent 15.7% |
| Icelanders | 82.4 /100 | #148 | Excellent 15.7% |
| Immigrants | Hungary | 80.9 /100 | #149 | Excellent 15.8% |
| Immigrants | Albania | 80.7 /100 | #150 | Excellent 15.8% |
| Venezuelans | 80.1 /100 | #151 | Excellent 15.8% |
| Immigrants | Kuwait | 79.4 /100 | #152 | Good 15.8% |
| Immigrants | Nepal | 78.5 /100 | #153 | Good 15.9% |
| Immigrants | Chile | 76.7 /100 | #154 | Good 15.9% |
| Syrians | 76.7 /100 | #155 | Good 15.9% |
| Immigrants | Fiji | 76.1 /100 | #156 | Good 15.9% |
| Colombians | 76.1 /100 | #157 | Good 15.9% |
| Guamanians/Chamorros | 75.3 /100 | #158 | Good 15.9% |
| Slovaks | 75.2 /100 | #159 | Good 15.9% |
| French | 72.8 /100 | #160 | Good 16.0% |
| Immigrants | Northern Africa | 72.0 /100 | #161 | Good 16.0% |
Demographics Similar to Immigrants from Southern Europe by Child Poverty Among Girls Under 16
In terms of child poverty among girls under 16, the demographic groups most similar to Immigrants from Southern Europe are Immigrants from Zimbabwe (15.3%, a difference of 0.11%), Immigrants from North Macedonia (15.2%, a difference of 0.18%), Pakistani (15.3%, a difference of 0.20%), English (15.3%, a difference of 0.22%), and Immigrants from Denmark (15.2%, a difference of 0.28%).
| Demographics | Rating | Rank | Child Poverty Among Girls Under 16 |
| Palestinians | 94.5 /100 | #111 | Exceptional 15.1% |
| Immigrants | Kazakhstan | 94.3 /100 | #112 | Exceptional 15.1% |
| Dutch | 94.3 /100 | #113 | Exceptional 15.1% |
| Sri Lankans | 94.0 /100 | #114 | Exceptional 15.2% |
| Belgians | 93.9 /100 | #115 | Exceptional 15.2% |
| Immigrants | Denmark | 93.3 /100 | #116 | Exceptional 15.2% |
| Immigrants | North Macedonia | 93.1 /100 | #117 | Exceptional 15.2% |
| Immigrants | Southern Europe | 92.7 /100 | #118 | Exceptional 15.3% |
| Immigrants | Zimbabwe | 92.5 /100 | #119 | Exceptional 15.3% |
| Pakistanis | 92.3 /100 | #120 | Exceptional 15.3% |
| English | 92.2 /100 | #121 | Exceptional 15.3% |
| Portuguese | 91.8 /100 | #122 | Exceptional 15.3% |
| Irish | 91.5 /100 | #123 | Exceptional 15.3% |
| Carpatho Rusyns | 91.4 /100 | #124 | Exceptional 15.3% |
| Peruvians | 91.2 /100 | #125 | Exceptional 15.4% |