Immigrants from Chile vs Immigrants from Southern Europe Single Mother Households
COMPARE
Immigrants from Chile
Immigrants from Southern Europe
Single Mother Households
Single Mother Households Comparison
Immigrants from Chile
Immigrants from Southern Europe
6.3%
SINGLE MOTHER HOUSEHOLDS
58.3/ 100
METRIC RATING
168th/ 347
METRIC RANK
6.1%
SINGLE MOTHER HOUSEHOLDS
80.5/ 100
METRIC RATING
151st/ 347
METRIC RANK
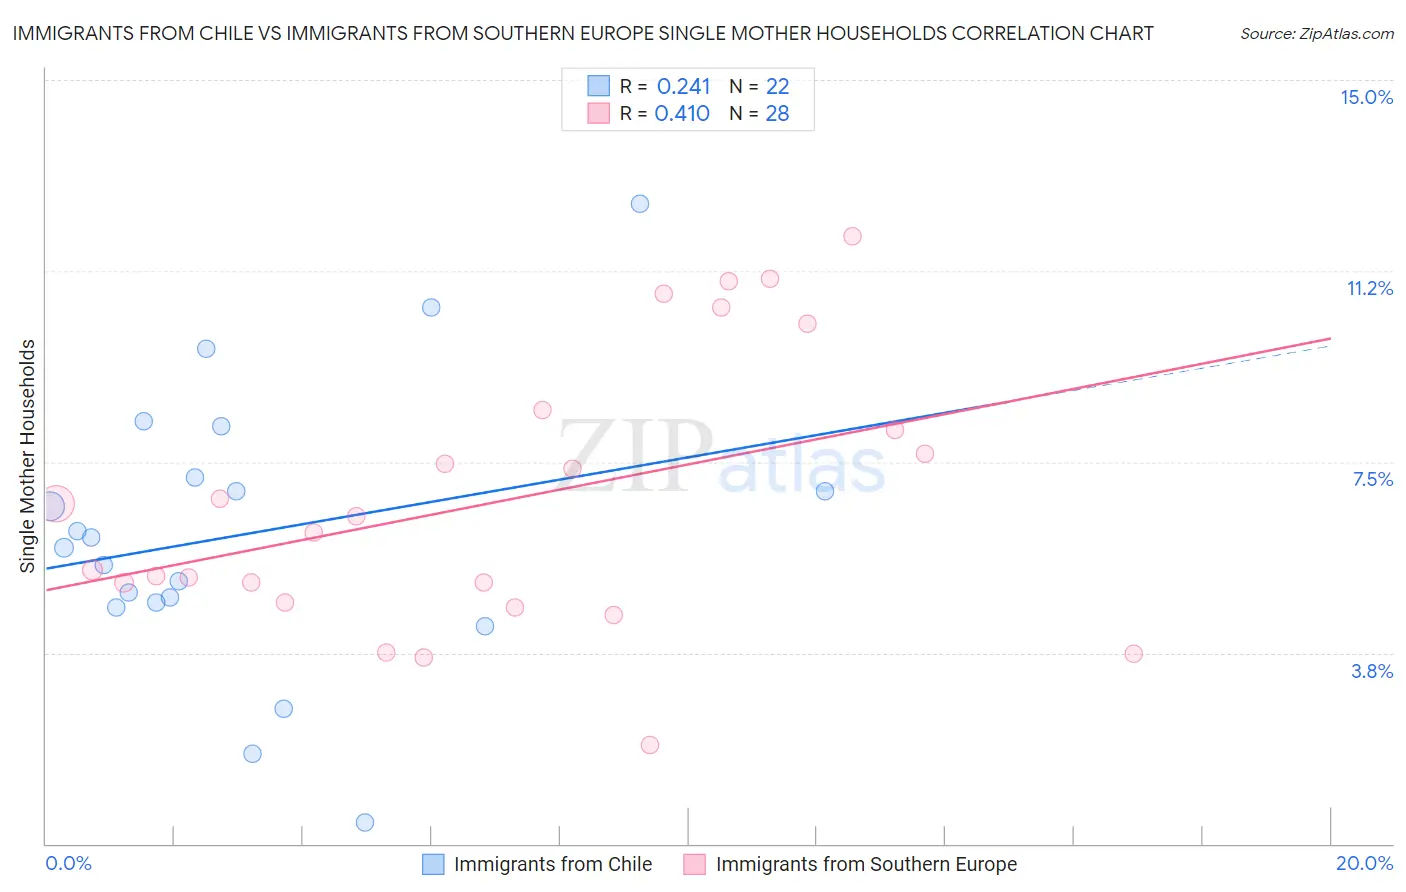
Immigrants from Chile vs Immigrants from Southern Europe Single Mother Households Correlation Chart
The statistical analysis conducted on geographies consisting of 218,462,093 people shows a weak positive correlation between the proportion of Immigrants from Chile and percentage of single mother households in the United States with a correlation coefficient (R) of 0.241 and weighted average of 6.3%. Similarly, the statistical analysis conducted on geographies consisting of 401,370,975 people shows a moderate positive correlation between the proportion of Immigrants from Southern Europe and percentage of single mother households in the United States with a correlation coefficient (R) of 0.410 and weighted average of 6.1%, a difference of 3.1%.
Single Mother Households Correlation Summary
| Measurement | Immigrants from Chile | Immigrants from Southern Europe |
| Minimum | 0.42% | 1.9% |
| Maximum | 12.6% | 11.9% |
| Range | 12.2% | 10.0% |
| Mean | 6.1% | 6.7% |
| Median | 5.9% | 6.3% |
| Interquartile 25% (IQ1) | 4.7% | 4.9% |
| Interquartile 75% (IQ3) | 7.2% | 8.3% |
| Interquartile Range (IQR) | 2.5% | 3.4% |
| Standard Deviation (Sample) | 2.8% | 2.7% |
| Standard Deviation (Population) | 2.7% | 2.6% |
Demographics Similar to Immigrants from Chile and Immigrants from Southern Europe by Single Mother Households
In terms of single mother households, the demographic groups most similar to Immigrants from Chile are Puget Sound Salish (6.3%, a difference of 0.020%), Brazilian (6.2%, a difference of 0.090%), Sri Lankan (6.2%, a difference of 0.65%), Immigrants from Syria (6.2%, a difference of 1.1%), and Immigrants from Northern Africa (6.2%, a difference of 1.2%). Similarly, the demographic groups most similar to Immigrants from Southern Europe are Zimbabwean (6.1%, a difference of 0.050%), Immigrants from Albania (6.1%, a difference of 0.19%), Pakistani (6.1%, a difference of 0.23%), Immigrants from Brazil (6.1%, a difference of 0.27%), and Immigrants from Philippines (6.1%, a difference of 0.34%).
| Demographics | Rating | Rank | Single Mother Households |
| Immigrants | Albania | 81.5 /100 | #149 | Excellent 6.1% |
| Zimbabweans | 80.7 /100 | #150 | Excellent 6.1% |
| Immigrants | Southern Europe | 80.5 /100 | #151 | Excellent 6.1% |
| Pakistanis | 79.2 /100 | #152 | Good 6.1% |
| Immigrants | Brazil | 78.9 /100 | #153 | Good 6.1% |
| Immigrants | Philippines | 78.5 /100 | #154 | Good 6.1% |
| Whites/Caucasians | 76.5 /100 | #155 | Good 6.1% |
| Native Hawaiians | 75.0 /100 | #156 | Good 6.1% |
| Chileans | 74.2 /100 | #157 | Good 6.1% |
| Celtics | 73.3 /100 | #158 | Good 6.1% |
| Yugoslavians | 73.1 /100 | #159 | Good 6.1% |
| Iraqis | 73.0 /100 | #160 | Good 6.1% |
| Immigrants | Germany | 72.4 /100 | #161 | Good 6.1% |
| Immigrants | Zimbabwe | 69.9 /100 | #162 | Good 6.2% |
| Alsatians | 68.7 /100 | #163 | Good 6.2% |
| Immigrants | Northern Africa | 68.0 /100 | #164 | Good 6.2% |
| Immigrants | Syria | 67.4 /100 | #165 | Good 6.2% |
| Sri Lankans | 63.9 /100 | #166 | Good 6.2% |
| Brazilians | 59.1 /100 | #167 | Average 6.2% |
| Immigrants | Chile | 58.3 /100 | #168 | Average 6.3% |
| Puget Sound Salish | 58.1 /100 | #169 | Average 6.3% |