Immigrants from Central America vs Chilean 6th Grade
COMPARE
Immigrants from Central America
Chilean
6th Grade
6th Grade Comparison
Immigrants from Central America
Chileans
94.0%
6TH GRADE
0.0/ 100
METRIC RATING
342nd/ 347
METRIC RANK
97.1%
6TH GRADE
52.1/ 100
METRIC RATING
170th/ 347
METRIC RANK
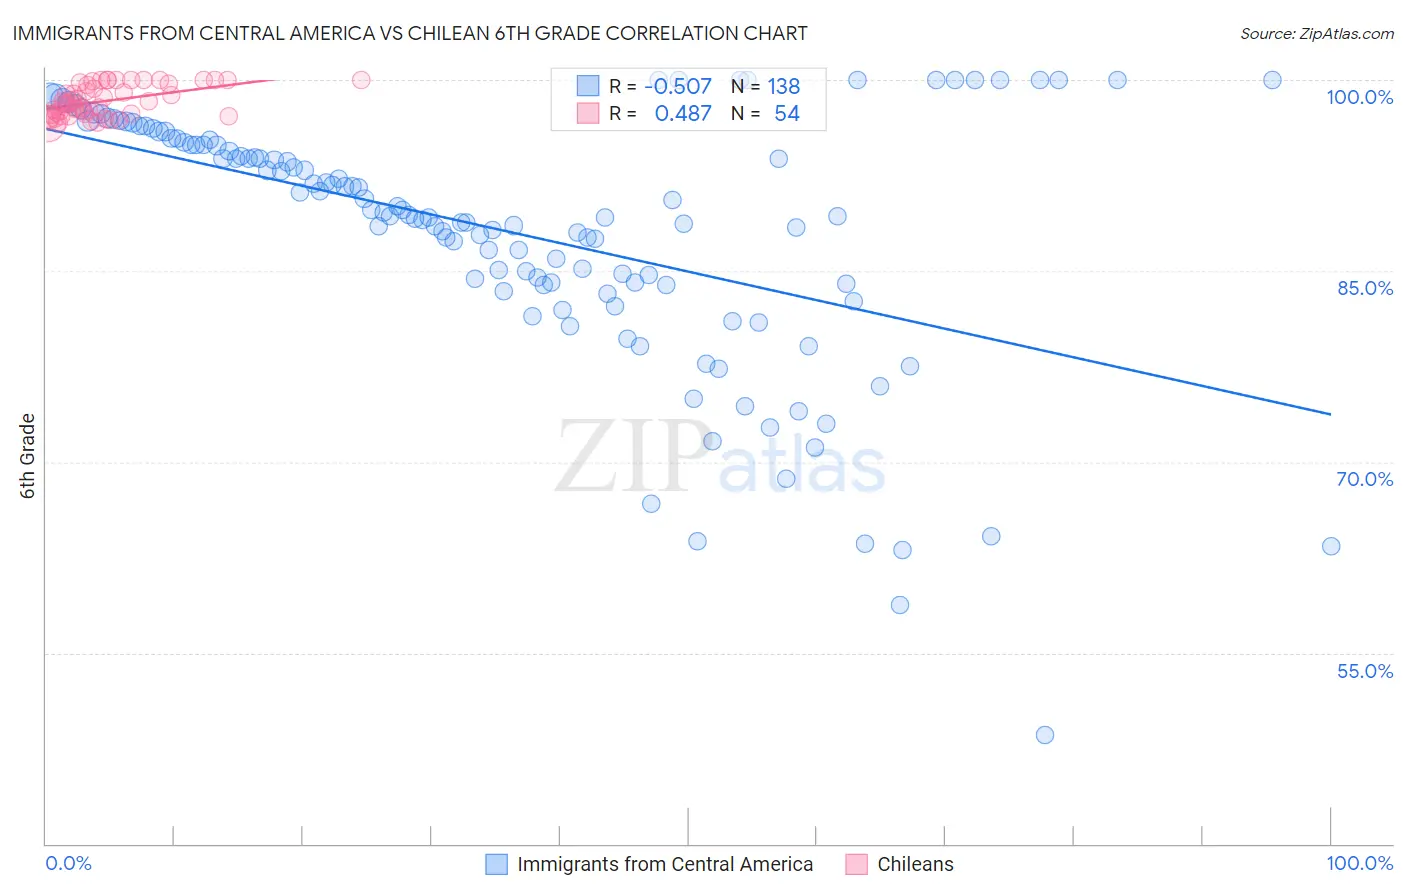
Immigrants from Central America vs Chilean 6th Grade Correlation Chart
The statistical analysis conducted on geographies consisting of 536,554,550 people shows a substantial negative correlation between the proportion of Immigrants from Central America and percentage of population with at least 6th grade education in the United States with a correlation coefficient (R) of -0.507 and weighted average of 94.0%. Similarly, the statistical analysis conducted on geographies consisting of 256,683,580 people shows a moderate positive correlation between the proportion of Chileans and percentage of population with at least 6th grade education in the United States with a correlation coefficient (R) of 0.487 and weighted average of 97.1%, a difference of 3.3%.
6th Grade Correlation Summary
| Measurement | Immigrants from Central America | Chilean |
| Minimum | 48.6% | 96.6% |
| Maximum | 100.0% | 100.0% |
| Range | 51.4% | 3.4% |
| Mean | 88.1% | 98.3% |
| Median | 89.5% | 98.2% |
| Interquartile 25% (IQ1) | 84.0% | 97.3% |
| Interquartile 75% (IQ3) | 95.3% | 99.8% |
| Interquartile Range (IQR) | 11.4% | 2.5% |
| Standard Deviation (Sample) | 9.9% | 1.2% |
| Standard Deviation (Population) | 9.9% | 1.2% |
Similar Demographics by 6th Grade
Demographics Similar to Immigrants from Central America by 6th Grade
In terms of 6th grade, the demographic groups most similar to Immigrants from Central America are Immigrants from Mexico (93.9%, a difference of 0.060%), Immigrants from Guatemala (93.9%, a difference of 0.060%), Salvadoran (93.9%, a difference of 0.070%), Immigrants from Yemen (94.1%, a difference of 0.10%), and Guatemalan (94.2%, a difference of 0.22%).
| Demographics | Rating | Rank | 6th Grade |
| Immigrants | Latin America | 0.0 /100 | #333 | Tragic 94.7% |
| Immigrants | Azores | 0.0 /100 | #334 | Tragic 94.7% |
| Mexicans | 0.0 /100 | #335 | Tragic 94.6% |
| Immigrants | Dominican Republic | 0.0 /100 | #336 | Tragic 94.6% |
| Central Americans | 0.0 /100 | #337 | Tragic 94.5% |
| Immigrants | Cabo Verde | 0.0 /100 | #338 | Tragic 94.4% |
| Yakama | 0.0 /100 | #339 | Tragic 94.3% |
| Guatemalans | 0.0 /100 | #340 | Tragic 94.2% |
| Immigrants | Yemen | 0.0 /100 | #341 | Tragic 94.1% |
| Immigrants | Central America | 0.0 /100 | #342 | Tragic 94.0% |
| Immigrants | Mexico | 0.0 /100 | #343 | Tragic 93.9% |
| Immigrants | Guatemala | 0.0 /100 | #344 | Tragic 93.9% |
| Salvadorans | 0.0 /100 | #345 | Tragic 93.9% |
| Spanish American Indians | 0.0 /100 | #346 | Tragic 93.6% |
| Immigrants | El Salvador | 0.0 /100 | #347 | Tragic 93.6% |
Demographics Similar to Chileans by 6th Grade
In terms of 6th grade, the demographic groups most similar to Chileans are Bermudan (97.1%, a difference of 0.0%), Immigrants from Sri Lanka (97.1%, a difference of 0.0%), Immigrants from Italy (97.1%, a difference of 0.010%), Apache (97.1%, a difference of 0.010%), and Immigrants from Taiwan (97.1%, a difference of 0.010%).
| Demographics | Rating | Rank | 6th Grade |
| Albanians | 57.8 /100 | #163 | Average 97.1% |
| Immigrants | Korea | 57.7 /100 | #164 | Average 97.1% |
| Immigrants | Poland | 56.2 /100 | #165 | Average 97.1% |
| Immigrants | Italy | 53.8 /100 | #166 | Average 97.1% |
| Apache | 53.6 /100 | #167 | Average 97.1% |
| Immigrants | Taiwan | 53.5 /100 | #168 | Average 97.1% |
| Bermudans | 52.6 /100 | #169 | Average 97.1% |
| Chileans | 52.1 /100 | #170 | Average 97.1% |
| Immigrants | Sri Lanka | 51.7 /100 | #171 | Average 97.1% |
| Egyptians | 50.9 /100 | #172 | Average 97.1% |
| Arabs | 50.1 /100 | #173 | Average 97.0% |
| Venezuelans | 50.0 /100 | #174 | Average 97.0% |
| Immigrants | Kazakhstan | 47.3 /100 | #175 | Average 97.0% |
| Immigrants | Micronesia | 47.1 /100 | #176 | Average 97.0% |
| Mongolians | 46.7 /100 | #177 | Average 97.0% |