Nonimmigrants vs Nigerian Child Poverty Under the Age of 5
COMPARE
Nonimmigrants
Nigerian
Child Poverty Under the Age of 5
Child Poverty Under the Age of 5 Comparison
Nonimmigrants
Nigerians
19.7%
CHILD POVERTY UNDER THE AGE OF 5
0.4/ 100
METRIC RATING
250th/ 347
METRIC RANK
19.1%
CHILD POVERTY UNDER THE AGE OF 5
1.6/ 100
METRIC RATING
225th/ 347
METRIC RANK
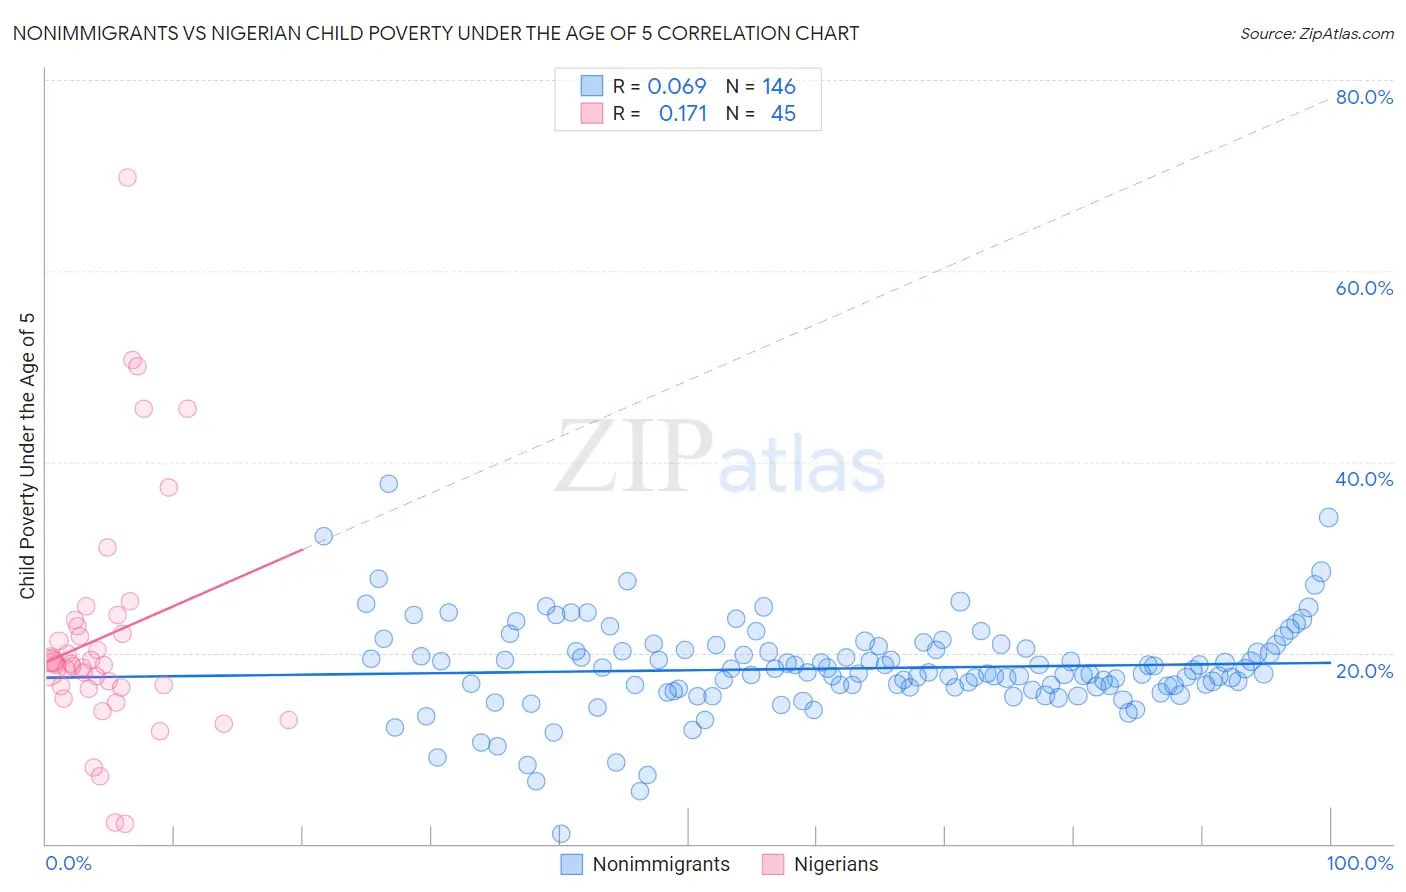
Nonimmigrants vs Nigerian Child Poverty Under the Age of 5 Correlation Chart
The statistical analysis conducted on geographies consisting of 540,384,913 people shows a slight positive correlation between the proportion of Nonimmigrants and poverty level among children under the age of 5 in the United States with a correlation coefficient (R) of 0.069 and weighted average of 19.7%. Similarly, the statistical analysis conducted on geographies consisting of 324,589,829 people shows a poor positive correlation between the proportion of Nigerians and poverty level among children under the age of 5 in the United States with a correlation coefficient (R) of 0.171 and weighted average of 19.1%, a difference of 3.5%.
Child Poverty Under the Age of 5 Correlation Summary
| Measurement | Nonimmigrants | Nigerian |
| Minimum | 1.0% | 2.1% |
| Maximum | 37.7% | 69.8% |
| Range | 36.6% | 67.7% |
| Mean | 18.4% | 21.8% |
| Median | 17.9% | 18.8% |
| Interquartile 25% (IQ1) | 16.4% | 16.3% |
| Interquartile 75% (IQ3) | 20.4% | 23.1% |
| Interquartile Range (IQR) | 4.0% | 6.8% |
| Standard Deviation (Sample) | 4.9% | 12.9% |
| Standard Deviation (Population) | 4.9% | 12.7% |
Similar Demographics by Child Poverty Under the Age of 5
Demographics Similar to Nonimmigrants by Child Poverty Under the Age of 5
In terms of child poverty under the age of 5, the demographic groups most similar to Nonimmigrants are Immigrants from Middle Africa (19.7%, a difference of 0.050%), Marshallese (19.7%, a difference of 0.070%), Guyanese (19.7%, a difference of 0.080%), Pennsylvania German (19.8%, a difference of 0.17%), and Immigrants from Nicaragua (19.8%, a difference of 0.22%).
| Demographics | Rating | Rank | Child Poverty Under the Age of 5 |
| Osage | 0.5 /100 | #243 | Tragic 19.6% |
| Immigrants | Ghana | 0.5 /100 | #244 | Tragic 19.6% |
| Immigrants | Western Africa | 0.4 /100 | #245 | Tragic 19.7% |
| Cree | 0.4 /100 | #246 | Tragic 19.7% |
| Guyanese | 0.4 /100 | #247 | Tragic 19.7% |
| Marshallese | 0.4 /100 | #248 | Tragic 19.7% |
| Immigrants | Middle Africa | 0.4 /100 | #249 | Tragic 19.7% |
| Immigrants | Nonimmigrants | 0.4 /100 | #250 | Tragic 19.7% |
| Pennsylvania Germans | 0.3 /100 | #251 | Tragic 19.8% |
| Immigrants | Nicaragua | 0.3 /100 | #252 | Tragic 19.8% |
| Mexican American Indians | 0.3 /100 | #253 | Tragic 19.9% |
| Fijians | 0.3 /100 | #254 | Tragic 19.9% |
| Immigrants | Cuba | 0.2 /100 | #255 | Tragic 19.9% |
| Immigrants | Barbados | 0.2 /100 | #256 | Tragic 20.0% |
| Shoshone | 0.2 /100 | #257 | Tragic 20.0% |
Demographics Similar to Nigerians by Child Poverty Under the Age of 5
In terms of child poverty under the age of 5, the demographic groups most similar to Nigerians are Immigrants from Eritrea (19.1%, a difference of 0.020%), Nicaraguan (19.1%, a difference of 0.030%), Cuban (19.1%, a difference of 0.14%), Alsatian (19.1%, a difference of 0.16%), and Cape Verdean (19.1%, a difference of 0.20%).
| Demographics | Rating | Rank | Child Poverty Under the Age of 5 |
| Delaware | 3.4 /100 | #218 | Tragic 18.7% |
| German Russians | 3.0 /100 | #219 | Tragic 18.8% |
| Immigrants | Azores | 2.6 /100 | #220 | Tragic 18.9% |
| Immigrants | Nigeria | 2.1 /100 | #221 | Tragic 19.0% |
| Alsatians | 1.7 /100 | #222 | Tragic 19.1% |
| Cubans | 1.7 /100 | #223 | Tragic 19.1% |
| Nicaraguans | 1.6 /100 | #224 | Tragic 19.1% |
| Nigerians | 1.6 /100 | #225 | Tragic 19.1% |
| Immigrants | Eritrea | 1.5 /100 | #226 | Tragic 19.1% |
| Cape Verdeans | 1.4 /100 | #227 | Tragic 19.1% |
| Immigrants | Sudan | 1.3 /100 | #228 | Tragic 19.2% |
| Ghanaians | 1.2 /100 | #229 | Tragic 19.2% |
| Ecuadorians | 1.2 /100 | #230 | Tragic 19.2% |
| Bermudans | 1.2 /100 | #231 | Tragic 19.2% |
| Trinidadians and Tobagonians | 0.9 /100 | #232 | Tragic 19.3% |