Spanish vs Nigerian Child Poverty Under the Age of 5
COMPARE
Spanish
Nigerian
Child Poverty Under the Age of 5
Child Poverty Under the Age of 5 Comparison
Spanish
Nigerians
18.2%
CHILD POVERTY UNDER THE AGE OF 5
9.8/ 100
METRIC RATING
209th/ 347
METRIC RANK
19.1%
CHILD POVERTY UNDER THE AGE OF 5
1.6/ 100
METRIC RATING
225th/ 347
METRIC RANK
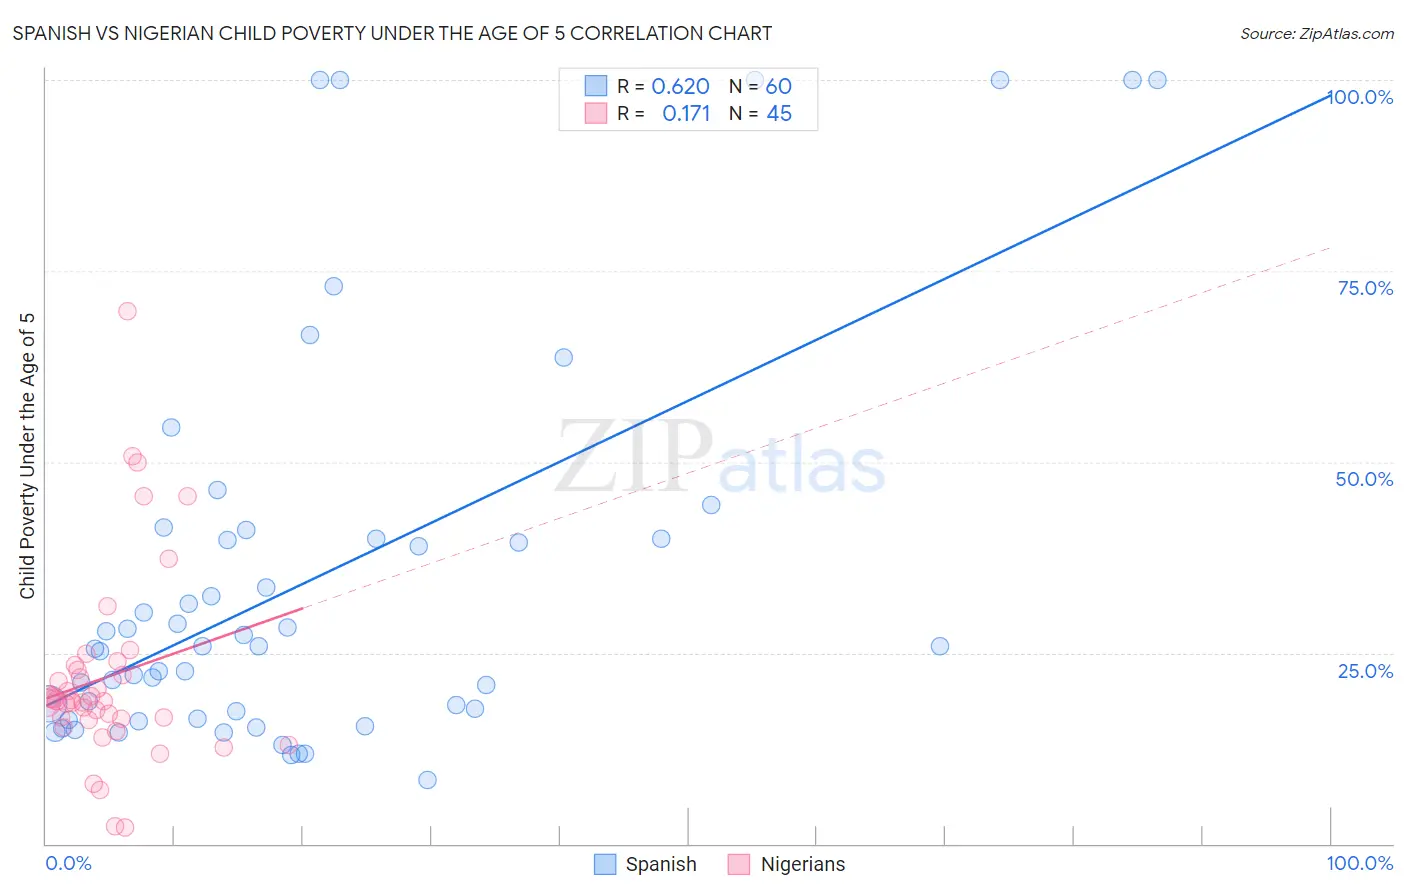
Spanish vs Nigerian Child Poverty Under the Age of 5 Correlation Chart
The statistical analysis conducted on geographies consisting of 404,966,909 people shows a significant positive correlation between the proportion of Spanish and poverty level among children under the age of 5 in the United States with a correlation coefficient (R) of 0.620 and weighted average of 18.2%. Similarly, the statistical analysis conducted on geographies consisting of 324,589,829 people shows a poor positive correlation between the proportion of Nigerians and poverty level among children under the age of 5 in the United States with a correlation coefficient (R) of 0.171 and weighted average of 19.1%, a difference of 4.7%.
Child Poverty Under the Age of 5 Correlation Summary
| Measurement | Spanish | Nigerian |
| Minimum | 8.4% | 2.1% |
| Maximum | 100.0% | 69.8% |
| Range | 91.6% | 67.7% |
| Mean | 34.6% | 21.8% |
| Median | 25.9% | 18.8% |
| Interquartile 25% (IQ1) | 16.9% | 16.3% |
| Interquartile 75% (IQ3) | 40.0% | 23.1% |
| Interquartile Range (IQR) | 23.1% | 6.8% |
| Standard Deviation (Sample) | 25.9% | 12.9% |
| Standard Deviation (Population) | 25.6% | 12.7% |
Demographics Similar to Spanish and Nigerians by Child Poverty Under the Age of 5
In terms of child poverty under the age of 5, the demographic groups most similar to Spanish are Scotch-Irish (18.2%, a difference of 0.010%), Panamanian (18.2%, a difference of 0.010%), Immigrants (18.2%, a difference of 0.020%), Moroccan (18.2%, a difference of 0.10%), and Nepalese (18.3%, a difference of 0.31%). Similarly, the demographic groups most similar to Nigerians are Immigrants from Eritrea (19.1%, a difference of 0.020%), Nicaraguan (19.1%, a difference of 0.030%), Cuban (19.1%, a difference of 0.14%), Alsatian (19.1%, a difference of 0.16%), and Cape Verdean (19.1%, a difference of 0.20%).
| Demographics | Rating | Rank | Child Poverty Under the Age of 5 |
| Immigrants | Immigrants | 9.9 /100 | #207 | Tragic 18.2% |
| Scotch-Irish | 9.8 /100 | #208 | Tragic 18.2% |
| Spanish | 9.8 /100 | #209 | Tragic 18.2% |
| Panamanians | 9.7 /100 | #210 | Tragic 18.2% |
| Moroccans | 9.4 /100 | #211 | Tragic 18.2% |
| Nepalese | 8.7 /100 | #212 | Tragic 18.3% |
| Immigrants | Thailand | 8.6 /100 | #213 | Tragic 18.3% |
| Malaysians | 6.5 /100 | #214 | Tragic 18.4% |
| Immigrants | Panama | 6.0 /100 | #215 | Tragic 18.5% |
| Hmong | 5.0 /100 | #216 | Tragic 18.5% |
| Immigrants | Africa | 4.6 /100 | #217 | Tragic 18.6% |
| Delaware | 3.4 /100 | #218 | Tragic 18.7% |
| German Russians | 3.0 /100 | #219 | Tragic 18.8% |
| Immigrants | Azores | 2.6 /100 | #220 | Tragic 18.9% |
| Immigrants | Nigeria | 2.1 /100 | #221 | Tragic 19.0% |
| Alsatians | 1.7 /100 | #222 | Tragic 19.1% |
| Cubans | 1.7 /100 | #223 | Tragic 19.1% |
| Nicaraguans | 1.6 /100 | #224 | Tragic 19.1% |
| Nigerians | 1.6 /100 | #225 | Tragic 19.1% |
| Immigrants | Eritrea | 1.5 /100 | #226 | Tragic 19.1% |
| Cape Verdeans | 1.4 /100 | #227 | Tragic 19.1% |