Immigrants from Cambodia vs Immigrants from Costa Rica Female Poverty Among 25-34 Year Olds
COMPARE
Immigrants from Cambodia
Immigrants from Costa Rica
Female Poverty Among 25-34 Year Olds
Female Poverty Among 25-34 Year Olds Comparison
Immigrants from Cambodia
Immigrants from Costa Rica
13.9%
FEMALE POVERTY AMONG 25-34 YEAR OLDS
24.0/ 100
METRIC RATING
195th/ 347
METRIC RANK
13.5%
FEMALE POVERTY AMONG 25-34 YEAR OLDS
51.9/ 100
METRIC RATING
172nd/ 347
METRIC RANK
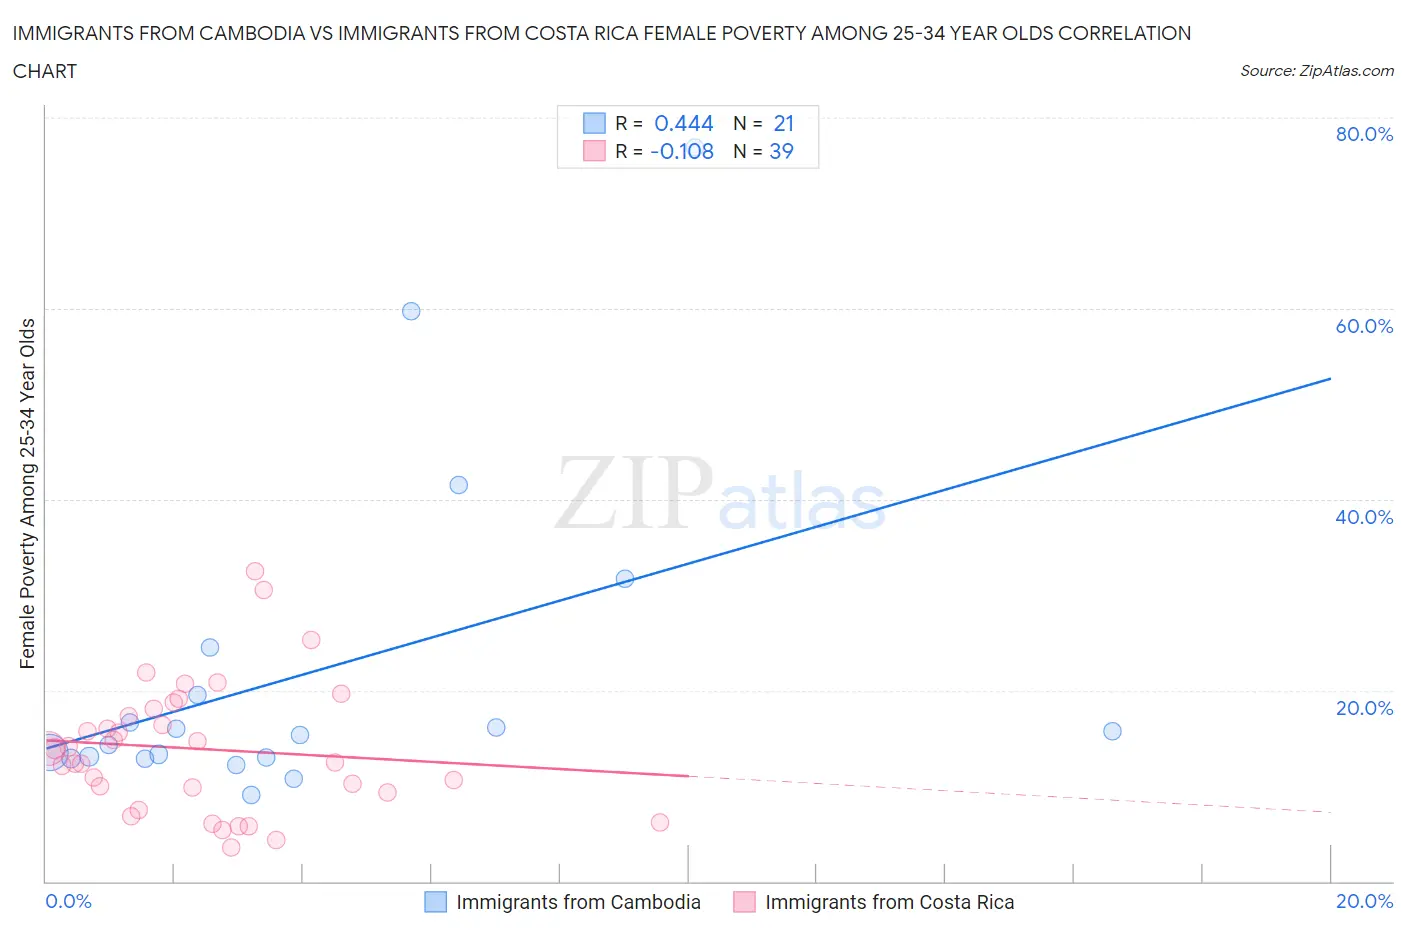
Immigrants from Cambodia vs Immigrants from Costa Rica Female Poverty Among 25-34 Year Olds Correlation Chart
The statistical analysis conducted on geographies consisting of 203,961,039 people shows a moderate positive correlation between the proportion of Immigrants from Cambodia and poverty level among females between the ages 25 and 34 in the United States with a correlation coefficient (R) of 0.444 and weighted average of 13.9%. Similarly, the statistical analysis conducted on geographies consisting of 202,973,935 people shows a poor negative correlation between the proportion of Immigrants from Costa Rica and poverty level among females between the ages 25 and 34 in the United States with a correlation coefficient (R) of -0.108 and weighted average of 13.5%, a difference of 2.5%.
Female Poverty Among 25-34 Year Olds Correlation Summary
| Measurement | Immigrants from Cambodia | Immigrants from Costa Rica |
| Minimum | 9.0% | 3.6% |
| Maximum | 76.9% | 32.4% |
| Range | 68.0% | 28.9% |
| Mean | 21.8% | 13.9% |
| Median | 15.4% | 13.9% |
| Interquartile 25% (IQ1) | 12.9% | 9.3% |
| Interquartile 75% (IQ3) | 22.0% | 18.1% |
| Interquartile Range (IQR) | 9.1% | 8.8% |
| Standard Deviation (Sample) | 17.4% | 6.8% |
| Standard Deviation (Population) | 17.0% | 6.7% |
Similar Demographics by Female Poverty Among 25-34 Year Olds
Demographics Similar to Immigrants from Cambodia by Female Poverty Among 25-34 Year Olds
In terms of female poverty among 25-34 year olds, the demographic groups most similar to Immigrants from Cambodia are Scottish (13.9%, a difference of 0.050%), Moroccan (13.8%, a difference of 0.11%), Immigrants from Saudi Arabia (13.9%, a difference of 0.25%), Immigrants from Germany (13.9%, a difference of 0.36%), and Immigrants from Kenya (13.8%, a difference of 0.42%).
| Demographics | Rating | Rank | Female Poverty Among 25-34 Year Olds |
| Immigrants | Eritrea | 32.7 /100 | #188 | Fair 13.7% |
| Finns | 32.5 /100 | #189 | Fair 13.7% |
| Dutch | 29.7 /100 | #190 | Fair 13.8% |
| Immigrants | St. Vincent and the Grenadines | 29.3 /100 | #191 | Fair 13.8% |
| Tlingit-Haida | 28.1 /100 | #192 | Fair 13.8% |
| Immigrants | Kenya | 28.0 /100 | #193 | Fair 13.8% |
| Moroccans | 25.1 /100 | #194 | Fair 13.8% |
| Immigrants | Cambodia | 24.0 /100 | #195 | Fair 13.9% |
| Scottish | 23.6 /100 | #196 | Fair 13.9% |
| Immigrants | Saudi Arabia | 21.9 /100 | #197 | Fair 13.9% |
| Immigrants | Germany | 20.9 /100 | #198 | Fair 13.9% |
| English | 20.4 /100 | #199 | Fair 13.9% |
| Hmong | 20.3 /100 | #200 | Fair 13.9% |
| Immigrants | Trinidad and Tobago | 17.6 /100 | #201 | Poor 14.0% |
| Welsh | 17.2 /100 | #202 | Poor 14.0% |
Demographics Similar to Immigrants from Costa Rica by Female Poverty Among 25-34 Year Olds
In terms of female poverty among 25-34 year olds, the demographic groups most similar to Immigrants from Costa Rica are South American Indian (13.5%, a difference of 0.0%), Kenyan (13.5%, a difference of 0.010%), Immigrants from Uganda (13.5%, a difference of 0.090%), Immigrants from Oceania (13.5%, a difference of 0.16%), and Samoan (13.5%, a difference of 0.41%).
| Demographics | Rating | Rank | Female Poverty Among 25-34 Year Olds |
| Basques | 59.3 /100 | #165 | Average 13.4% |
| Belgians | 58.9 /100 | #166 | Average 13.4% |
| Immigrants | Bosnia and Herzegovina | 58.6 /100 | #167 | Average 13.4% |
| Immigrants | Afghanistan | 57.7 /100 | #168 | Average 13.4% |
| Samoans | 56.8 /100 | #169 | Average 13.5% |
| Immigrants | Uganda | 53.0 /100 | #170 | Average 13.5% |
| South American Indians | 51.9 /100 | #171 | Average 13.5% |
| Immigrants | Costa Rica | 51.9 /100 | #172 | Average 13.5% |
| Kenyans | 51.8 /100 | #173 | Average 13.5% |
| Immigrants | Oceania | 50.0 /100 | #174 | Average 13.5% |
| Bermudans | 46.8 /100 | #175 | Average 13.6% |
| Yugoslavians | 45.0 /100 | #176 | Average 13.6% |
| Venezuelans | 44.6 /100 | #177 | Average 13.6% |
| Canadians | 44.3 /100 | #178 | Average 13.6% |
| Immigrants | Eastern Africa | 43.6 /100 | #179 | Average 13.6% |