Immigrants from Burma/Myanmar vs Immigrants from Russia 8th Grade
COMPARE
Immigrants from Burma/Myanmar
Immigrants from Russia
8th Grade
8th Grade Comparison
Immigrants from Burma/Myanmar
Immigrants from Russia
94.1%
8TH GRADE
0.0/ 100
METRIC RATING
300th/ 347
METRIC RANK
96.0%
8TH GRADE
80.9/ 100
METRIC RATING
150th/ 347
METRIC RANK
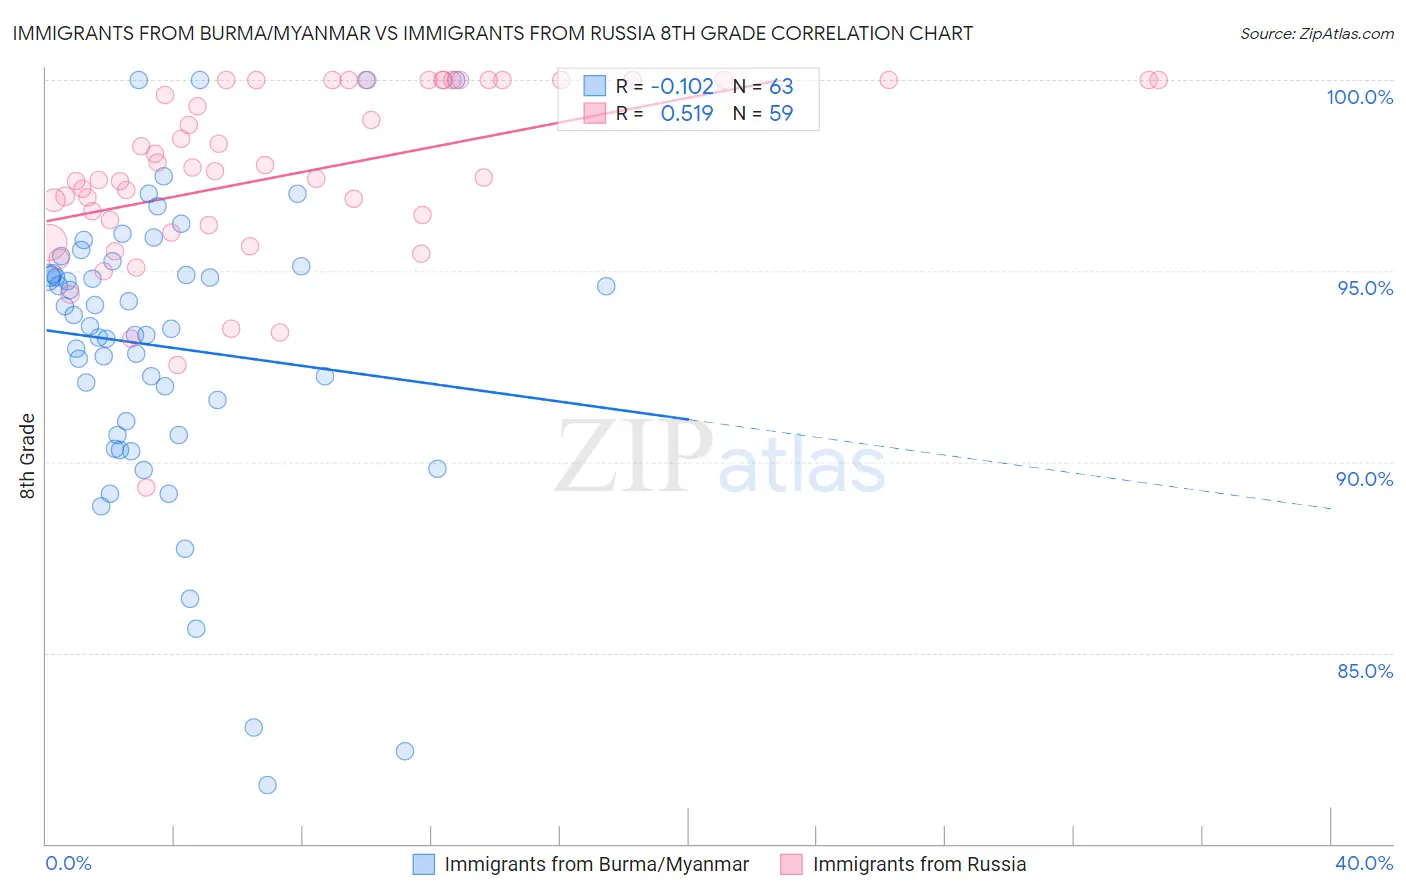
Immigrants from Burma/Myanmar vs Immigrants from Russia 8th Grade Correlation Chart
The statistical analysis conducted on geographies consisting of 172,345,696 people shows a poor negative correlation between the proportion of Immigrants from Burma/Myanmar and percentage of population with at least 8th grade education in the United States with a correlation coefficient (R) of -0.102 and weighted average of 94.1%. Similarly, the statistical analysis conducted on geographies consisting of 347,948,494 people shows a substantial positive correlation between the proportion of Immigrants from Russia and percentage of population with at least 8th grade education in the United States with a correlation coefficient (R) of 0.519 and weighted average of 96.0%, a difference of 2.0%.
8th Grade Correlation Summary
| Measurement | Immigrants from Burma/Myanmar | Immigrants from Russia |
| Minimum | 81.5% | 89.3% |
| Maximum | 100.0% | 100.0% |
| Range | 18.5% | 10.7% |
| Mean | 93.0% | 97.5% |
| Median | 93.5% | 97.6% |
| Interquartile 25% (IQ1) | 90.7% | 96.2% |
| Interquartile 75% (IQ3) | 95.1% | 100.0% |
| Interquartile Range (IQR) | 4.4% | 3.8% |
| Standard Deviation (Sample) | 3.9% | 2.3% |
| Standard Deviation (Population) | 3.9% | 2.3% |
Similar Demographics by 8th Grade
Demographics Similar to Immigrants from Burma/Myanmar by 8th Grade
In terms of 8th grade, the demographic groups most similar to Immigrants from Burma/Myanmar are Cuban (94.1%, a difference of 0.010%), Immigrants from Laos (94.1%, a difference of 0.020%), Indonesian (94.1%, a difference of 0.030%), Immigrants from South Eastern Asia (94.2%, a difference of 0.070%), and Haitian (94.2%, a difference of 0.080%).
| Demographics | Rating | Rank | 8th Grade |
| Yaqui | 0.0 /100 | #293 | Tragic 94.2% |
| Houma | 0.0 /100 | #294 | Tragic 94.2% |
| Fijians | 0.0 /100 | #295 | Tragic 94.2% |
| Haitians | 0.0 /100 | #296 | Tragic 94.2% |
| Immigrants | South Eastern Asia | 0.0 /100 | #297 | Tragic 94.2% |
| Indonesians | 0.0 /100 | #298 | Tragic 94.1% |
| Cubans | 0.0 /100 | #299 | Tragic 94.1% |
| Immigrants | Burma/Myanmar | 0.0 /100 | #300 | Tragic 94.1% |
| Immigrants | Laos | 0.0 /100 | #301 | Tragic 94.1% |
| Sri Lankans | 0.0 /100 | #302 | Tragic 94.0% |
| Immigrants | Dominica | 0.0 /100 | #303 | Tragic 94.0% |
| Guyanese | 0.0 /100 | #304 | Tragic 93.9% |
| Immigrants | Haiti | 0.0 /100 | #305 | Tragic 93.9% |
| Immigrants | Guyana | 0.0 /100 | #306 | Tragic 93.8% |
| Immigrants | Portugal | 0.0 /100 | #307 | Tragic 93.8% |
Demographics Similar to Immigrants from Russia by 8th Grade
In terms of 8th grade, the demographic groups most similar to Immigrants from Russia are Immigrants from Israel (96.0%, a difference of 0.0%), Blackfeet (96.0%, a difference of 0.0%), French American Indian (96.0%, a difference of 0.0%), Immigrants from Jordan (95.9%, a difference of 0.010%), and Albanian (96.0%, a difference of 0.020%).
| Demographics | Rating | Rank | 8th Grade |
| Spanish | 85.1 /100 | #143 | Excellent 96.0% |
| Immigrants | Belarus | 84.8 /100 | #144 | Excellent 96.0% |
| Lumbee | 84.1 /100 | #145 | Excellent 96.0% |
| Israelis | 84.1 /100 | #146 | Excellent 96.0% |
| Colville | 84.0 /100 | #147 | Excellent 96.0% |
| Albanians | 83.1 /100 | #148 | Excellent 96.0% |
| Immigrants | Israel | 81.3 /100 | #149 | Excellent 96.0% |
| Immigrants | Russia | 80.9 /100 | #150 | Excellent 96.0% |
| Blackfeet | 80.8 /100 | #151 | Excellent 96.0% |
| French American Indians | 80.6 /100 | #152 | Excellent 96.0% |
| Immigrants | Jordan | 79.5 /100 | #153 | Good 95.9% |
| Hopi | 79.4 /100 | #154 | Good 95.9% |
| Kenyans | 74.5 /100 | #155 | Good 95.9% |
| Ugandans | 74.1 /100 | #156 | Good 95.9% |
| Immigrants | Taiwan | 70.5 /100 | #157 | Good 95.9% |