Immigrants from Trinidad and Tobago vs Immigrants from Australia Family Poverty
COMPARE
Immigrants from Trinidad and Tobago
Immigrants from Australia
Family Poverty
Family Poverty Comparison
Immigrants from Trinidad and Tobago
Immigrants from Australia
10.9%
FAMILY POVERTY
0.1/ 100
METRIC RATING
265th/ 347
METRIC RANK
7.6%
FAMILY POVERTY
99.2/ 100
METRIC RATING
41st/ 347
METRIC RANK
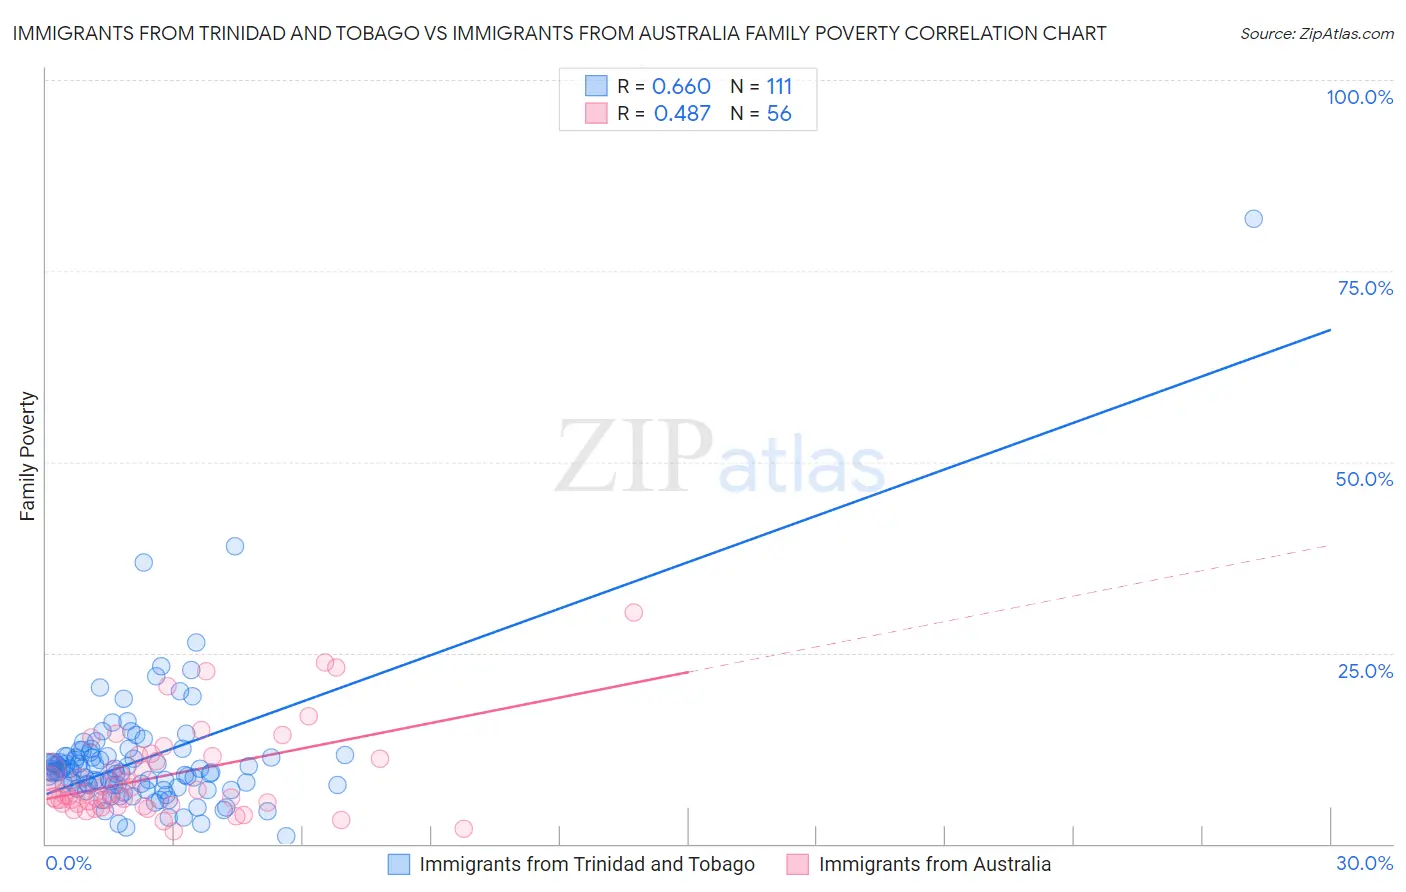
Immigrants from Trinidad and Tobago vs Immigrants from Australia Family Poverty Correlation Chart
The statistical analysis conducted on geographies consisting of 223,249,707 people shows a significant positive correlation between the proportion of Immigrants from Trinidad and Tobago and poverty level among families in the United States with a correlation coefficient (R) of 0.660 and weighted average of 10.9%. Similarly, the statistical analysis conducted on geographies consisting of 226,808,313 people shows a moderate positive correlation between the proportion of Immigrants from Australia and poverty level among families in the United States with a correlation coefficient (R) of 0.487 and weighted average of 7.6%, a difference of 44.7%.
Family Poverty Correlation Summary
| Measurement | Immigrants from Trinidad and Tobago | Immigrants from Australia |
| Minimum | 1.1% | 1.7% |
| Maximum | 81.8% | 30.3% |
| Range | 80.8% | 28.6% |
| Mean | 11.1% | 8.9% |
| Median | 9.4% | 6.5% |
| Interquartile 25% (IQ1) | 7.6% | 5.2% |
| Interquartile 75% (IQ3) | 11.5% | 11.4% |
| Interquartile Range (IQR) | 3.9% | 6.2% |
| Standard Deviation (Sample) | 8.9% | 6.0% |
| Standard Deviation (Population) | 8.9% | 5.9% |
Similar Demographics by Family Poverty
Demographics Similar to Immigrants from Trinidad and Tobago by Family Poverty
In terms of family poverty, the demographic groups most similar to Immigrants from Trinidad and Tobago are Trinidadian and Tobagonian (10.9%, a difference of 0.060%), Cape Verdean (10.9%, a difference of 0.070%), Spanish American Indian (10.9%, a difference of 0.33%), Shoshone (10.9%, a difference of 0.46%), and Bangladeshi (10.9%, a difference of 0.50%).
| Demographics | Rating | Rank | Family Poverty |
| Sub-Saharan Africans | 0.2 /100 | #258 | Tragic 10.9% |
| Mexican American Indians | 0.2 /100 | #259 | Tragic 10.9% |
| Bangladeshis | 0.2 /100 | #260 | Tragic 10.9% |
| Shoshone | 0.2 /100 | #261 | Tragic 10.9% |
| Spanish American Indians | 0.2 /100 | #262 | Tragic 10.9% |
| Cape Verdeans | 0.1 /100 | #263 | Tragic 10.9% |
| Trinidadians and Tobagonians | 0.1 /100 | #264 | Tragic 10.9% |
| Immigrants | Trinidad and Tobago | 0.1 /100 | #265 | Tragic 10.9% |
| Immigrants | El Salvador | 0.1 /100 | #266 | Tragic 11.0% |
| Comanche | 0.1 /100 | #267 | Tragic 11.0% |
| Jamaicans | 0.1 /100 | #268 | Tragic 11.1% |
| Immigrants | Ecuador | 0.1 /100 | #269 | Tragic 11.1% |
| Immigrants | Nicaragua | 0.1 /100 | #270 | Tragic 11.1% |
| Immigrants | Bahamas | 0.1 /100 | #271 | Tragic 11.1% |
| Immigrants | Jamaica | 0.1 /100 | #272 | Tragic 11.2% |
Demographics Similar to Immigrants from Australia by Family Poverty
In terms of family poverty, the demographic groups most similar to Immigrants from Australia are Slovene (7.5%, a difference of 0.30%), Carpatho Rusyn (7.5%, a difference of 0.34%), Bolivian (7.5%, a difference of 0.40%), Scandinavian (7.6%, a difference of 0.63%), and Estonian (7.5%, a difference of 0.64%).
| Demographics | Rating | Rank | Family Poverty |
| Russians | 99.5 /100 | #34 | Exceptional 7.5% |
| Greeks | 99.4 /100 | #35 | Exceptional 7.5% |
| Turks | 99.4 /100 | #36 | Exceptional 7.5% |
| Estonians | 99.4 /100 | #37 | Exceptional 7.5% |
| Bolivians | 99.3 /100 | #38 | Exceptional 7.5% |
| Carpatho Rusyns | 99.3 /100 | #39 | Exceptional 7.5% |
| Slovenes | 99.3 /100 | #40 | Exceptional 7.5% |
| Immigrants | Australia | 99.2 /100 | #41 | Exceptional 7.6% |
| Scandinavians | 99.1 /100 | #42 | Exceptional 7.6% |
| Immigrants | Austria | 99.1 /100 | #43 | Exceptional 7.6% |
| Germans | 99.0 /100 | #44 | Exceptional 7.7% |
| Okinawans | 98.9 /100 | #45 | Exceptional 7.7% |
| Tongans | 98.9 /100 | #46 | Exceptional 7.7% |
| Immigrants | Czechoslovakia | 98.9 /100 | #47 | Exceptional 7.7% |
| Immigrants | Sri Lanka | 98.9 /100 | #48 | Exceptional 7.7% |