German Russian vs Immigrants from Japan Female Poverty Among 25-34 Year Olds

COMPARE

German Russian
Race
Ancestry
AfghanAfricanAlaska NativeAlaskan AthabascanAlbanianAleutAlsatianAmericanApacheArabArapahoArgentineanArmenianAssyrian/Chaldean/SyriacAustralianAustrianBahamianBangladeshiBarbadianBasqueBelgianBelizeanBermudanBhutaneseBlackfeetBolivianBrazilianBritishBritish West IndianBulgarianBurmeseCajunCambodianCanadianCape VerdeanCarpatho RusynCelticCentral AmericanCentral American IndianCherokeeCheyenneChickasawChileanChineseChippewaChoctawColombianColvilleComancheCosta RicanCreeCreekCroatianCrowCubanCypriotCzechCzechoslovakianDanishDelawareDominicanDutchDutch West IndianEastern EuropeanEcuadorianEgyptianEnglishEstonianEthiopianEuropeanFijianFilipinoFinnishFrenchFrench American IndianFrench CanadianGermanGerman RussianGhanaianGreekGuamanian/ChamorroGuatemalanGuyaneseHaitianHmongHonduranHopiHoumaHungarianIcelanderIndian (Asian)IndonesianInupiatIranianIraqiIrishIroquoisIsraeliItalianJamaicanJapaneseJordanianKenyanKiowaKoreanLaotianLatvianLebaneseLiberianLithuanianLumbeeLuxembourgerMacedonianMalaysianMalteseMarshalleseMenomineeMexicanMexican American IndianMongolianMoroccanNative HawaiianNavajoNepaleseNew ZealanderNicaraguanNigerianNorthern EuropeanNorwegianOkinawanOsageOttawaPaiutePakistaniPalestinianPanamanianParaguayanPennsylvania GermanPeruvianPimaPolishPortuguesePotawatomiPuebloPuerto RicanPuget Sound SalishRomanianRussianSalvadoranSamoanScandinavianScotch-IrishScottishSeminoleSenegaleseSerbianShoshoneSierra LeoneanSiouxSlavicSlovakSloveneSomaliSouth AfricanSouth AmericanSouth American IndianSoviet UnionSpaniardSpanishSpanish AmericanSpanish American IndianSri LankanSubsaharan AfricanSudaneseSwedishSwissSyrianTaiwaneseThaiTlingit-HaidaTohono O'OdhamTonganTrinidadian and TobagonianTsimshianTurkishU.S. Virgin IslanderUgandanUkrainianUruguayanUteVenezuelanVietnameseWelshWest IndianYakamaYaquiYugoslavianYumanYup'ikZimbabwean
Immigration
NonimmigrantsImmigrantsAfghanistanAfricaAlbaniaArgentinaArmeniaAsiaAustraliaAustriaBahamasBangladeshBarbadosBelarusBelgiumBelizeBoliviaBosnia and HerzegovinaBrazilBulgariaBurma/MyanmarCabo VerdeCambodiaCameroonCanadaCaribbeanCentral AmericaChileChinaColombiaCongoCosta RicaCroatiaCubaCzechoslovakiaDenmarkDominicaDominican RepublicEastern AfricaEastern AsiaEastern EuropeEcuadorEgyptEl SalvadorEnglandEritreaEthiopiaEuropeFijiFranceGermanyGhanaGreeceGrenadaGuatemalaGuyanaHaitiHondurasHong KongHungaryIndiaIndonesiaIranIraqIrelandIsraelItalyJamaicaJordanKazakhstanKenyaKoreaKuwaitLaosLatin AmericaLatviaLebanonLiberiaLithuaniaMalaysiaMexicoMicronesiaMiddle AfricaMoldovaMoroccoNepalNetherlandsNicaraguaNigeriaNorth AmericaNorth MacedoniaNorthern AfricaNorthern EuropeNorwayOceaniaPakistanPanamaPeruPhilippinesPolandPortugalRomaniaRussiaSaudi ArabiaScotlandSenegalSerbiaSierra LeoneSingaporeSomaliaSouth AfricaSouth AmericaSouth Central AsiaSouth Eastern AsiaSouthern EuropeSpainSri LankaSt. Vincent and the GrenadinesSudanSwedenSwitzerlandSyriaTaiwanThailandTrinidad and TobagoTurkeyUgandaUkraineUruguayUzbekistanVenezuelaVietnamWest IndiesWestern AfricaWestern AsiaWestern EuropeYemenZaireZimbabweAzores
Immigrants from Japan
Race
Ancestry
AfghanAfricanAlaska NativeAlaskan AthabascanAlbanianAleutAlsatianAmericanApacheArabArapahoArgentineanArmenianAssyrian/Chaldean/SyriacAustralianAustrianBahamianBangladeshiBarbadianBasqueBelgianBelizeanBermudanBhutaneseBlackfeetBolivianBrazilianBritishBritish West IndianBulgarianBurmeseCajunCambodianCanadianCape VerdeanCarpatho RusynCelticCentral AmericanCentral American IndianCherokeeCheyenneChickasawChileanChineseChippewaChoctawColombianColvilleComancheCosta RicanCreeCreekCroatianCrowCubanCypriotCzechCzechoslovakianDanishDelawareDominicanDutchDutch West IndianEastern EuropeanEcuadorianEgyptianEnglishEstonianEthiopianEuropeanFijianFilipinoFinnishFrenchFrench American IndianFrench CanadianGermanGhanaianGreekGuamanian/ChamorroGuatemalanGuyaneseHaitianHmongHonduranHopiHoumaHungarianIcelanderIndian (Asian)IndonesianInupiatIranianIraqiIrishIroquoisIsraeliItalianJamaicanJapaneseJordanianKenyanKiowaKoreanLaotianLatvianLebaneseLiberianLithuanianLumbeeLuxembourgerMacedonianMalaysianMalteseMarshalleseMenomineeMexicanMexican American IndianMongolianMoroccanNative HawaiianNavajoNepaleseNew ZealanderNicaraguanNigerianNorthern EuropeanNorwegianOkinawanOsageOttawaPaiutePakistaniPalestinianPanamanianParaguayanPennsylvania GermanPeruvianPimaPolishPortuguesePotawatomiPuebloPuerto RicanPuget Sound SalishRomanianRussianSalvadoranSamoanScandinavianScotch-IrishScottishSeminoleSenegaleseSerbianShoshoneSierra LeoneanSiouxSlavicSlovakSloveneSomaliSouth AfricanSouth AmericanSouth American IndianSoviet UnionSpaniardSpanishSpanish AmericanSpanish American IndianSri LankanSubsaharan AfricanSudaneseSwedishSwissSyrianTaiwaneseThaiTlingit-HaidaTohono O'OdhamTonganTrinidadian and TobagonianTsimshianTurkishU.S. Virgin IslanderUgandanUkrainianUruguayanUteVenezuelanVietnameseWelshWest IndianYakamaYaquiYugoslavianYumanYup'ikZimbabwean
Immigration
NonimmigrantsImmigrantsAfghanistanAfricaAlbaniaArgentinaArmeniaAsiaAustraliaAustriaBahamasBangladeshBarbadosBelarusBelgiumBelizeBoliviaBosnia and HerzegovinaBrazilBulgariaBurma/MyanmarCabo VerdeCambodiaCameroonCanadaCaribbeanCentral AmericaChileChinaColombiaCongoCosta RicaCroatiaCubaCzechoslovakiaDenmarkDominicaDominican RepublicEastern AfricaEastern AsiaEastern EuropeEcuadorEgyptEl SalvadorEnglandEritreaEthiopiaEuropeFijiFranceGermanyGhanaGreeceGrenadaGuatemalaGuyanaHaitiHondurasHong KongHungaryIndiaIndonesiaIranIraqIrelandIsraelItalyJamaicaJapanJordanKazakhstanKenyaKoreaKuwaitLaosLatin AmericaLatviaLebanonLiberiaLithuaniaMalaysiaMexicoMicronesiaMiddle AfricaMoldovaMoroccoNepalNetherlandsNicaraguaNigeriaNorth AmericaNorth MacedoniaNorthern AfricaNorthern EuropeNorwayOceaniaPakistanPanamaPeruPhilippinesPolandPortugalRomaniaRussiaSaudi ArabiaScotlandSenegalSerbiaSierra LeoneSingaporeSomaliaSouth AfricaSouth AmericaSouth Central AsiaSouth Eastern AsiaSouthern EuropeSpainSri LankaSt. Vincent and the GrenadinesSudanSwedenSwitzerlandSyriaTaiwanThailandTrinidad and TobagoTurkeyUgandaUkraineUruguayUzbekistanVenezuelaVietnamWest IndiesWestern AfricaWestern AsiaWestern EuropeYemenZaireZimbabweAzores
Female Poverty Among 25-34 Year Olds
Income
Poverty
Unemployment
Labor Participation
Family Structure
Vehicle Availability
Education Level
Disability

Female Poverty Among 25-34 Year Olds Comparison

German Russians

Immigrants from Japan

Tragic
Exceptional
14.9%
FEMALE POVERTY AMONG 25-34 YEAR OLDS
0.8/ 100
METRIC RATING
247th/ 347
METRIC RANK
11.6%
FEMALE POVERTY AMONG 25-34 YEAR OLDS
99.9/ 100
METRIC RATING
31st/ 347
METRIC RANK

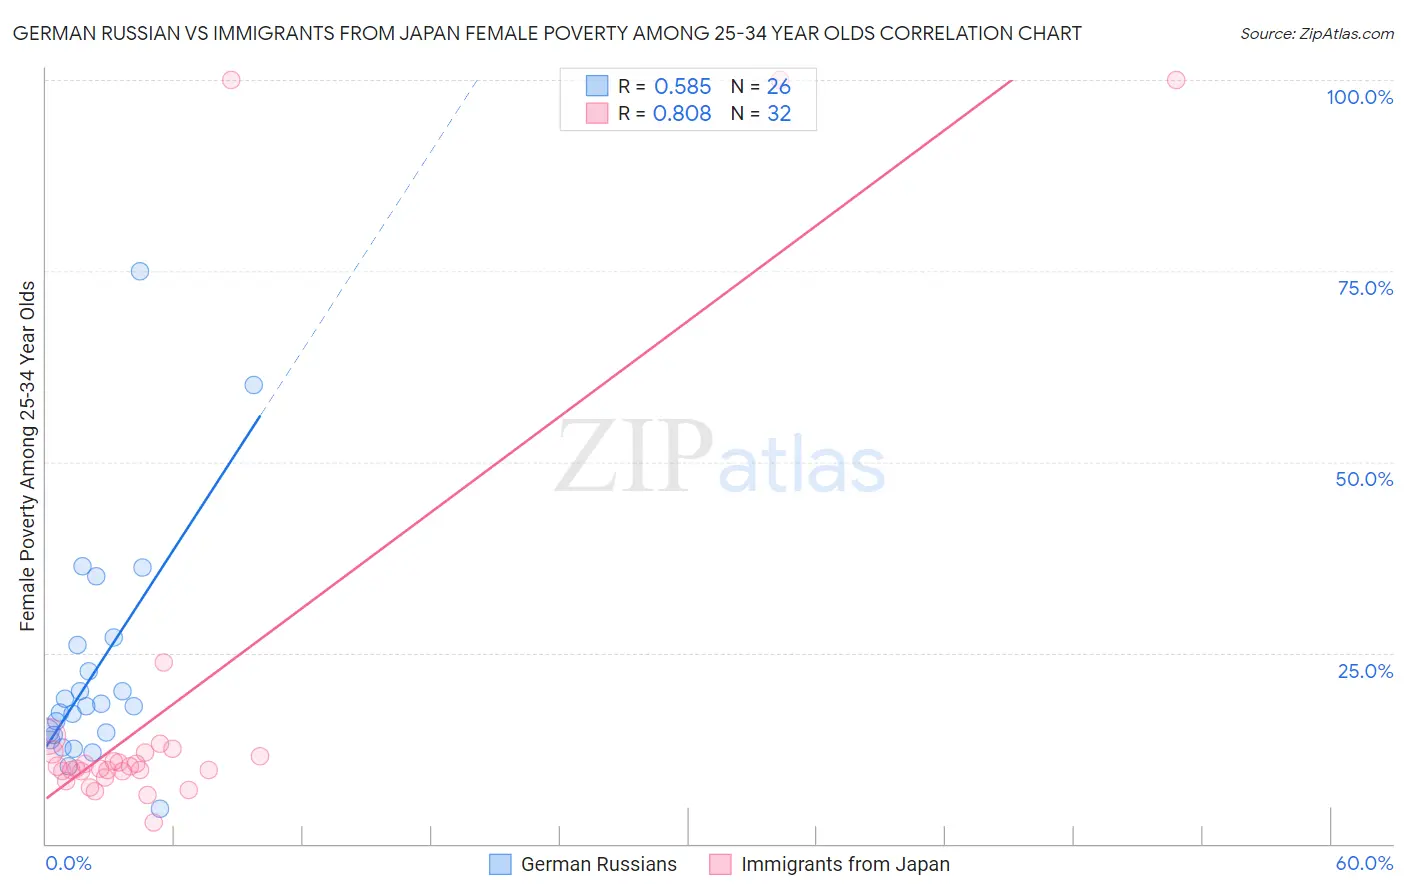
German Russian vs Immigrants from Japan Female Poverty Among 25-34 Year Olds Correlation Chart

The statistical analysis conducted on geographies consisting of 96,128,428 people shows a substantial positive correlation between the proportion of German Russians and poverty level among females between the ages 25 and 34 in the United States with a correlation coefficient (R) of 0.585 and weighted average of 14.9%. Similarly, the statistical analysis conducted on geographies consisting of 335,631,961 people shows a very strong positive correlation between the proportion of Immigrants from Japan and poverty level among females between the ages 25 and 34 in the United States with a correlation coefficient (R) of 0.808 and weighted average of 11.6%, a difference of 28.6%.
German Russian vs Immigrants from Japan Female Poverty Among 25-34 Year Olds

Female Poverty Among 25-34 Year Olds Correlation Summary

MeasurementGerman RussianImmigrants from Japan
Minimum4.7%2.8%
Maximum75.0%100.0%
Range70.3%97.3%
Mean22.7%18.6%
Median18.0%10.0%
Interquartile 25% (IQ1)14.3%9.4%
Interquartile 75% (IQ3)26.1%12.0%
Interquartile Range (IQR)11.8%2.5%
Standard Deviation (Sample)15.4%26.8%
Standard Deviation (Population)15.1%26.4%

Similar Demographics by Female Poverty Among 25-34 Year Olds

Demographics Similar to German Russians by Female Poverty Among 25-34 Year Olds

In terms of female poverty among 25-34 year olds, the demographic groups most similar to German Russians are Immigrants from Western Africa (14.9%, a difference of 0.040%), Jamaican (14.8%, a difference of 0.34%), Immigrants from Middle Africa (14.8%, a difference of 0.38%), Immigrants from Bangladesh (14.8%, a difference of 0.56%), and Immigrants from Nicaragua (14.8%, a difference of 0.57%).
DemographicsRating | RankFemale Poverty Among 25-34 Year Olds
Immigrants | Grenada
1.3
/100
|
#240
Tragic
14.7%
Scotch-Irish
1.2
/100
|
#241
Tragic
14.8%
Barbadians
1.2
/100
|
#242
Tragic
14.8%
Immigrants | Nicaragua
1.1
/100
|
#243
Tragic
14.8%
Immigrants | Bangladesh
1.1
/100
|
#244
Tragic
14.8%
Immigrants | Middle Africa
1.0
/100
|
#245
Tragic
14.8%
Jamaicans
1.0
/100
|
#246
Tragic
14.8%
German Russians
0.8
/100
|
#247
Tragic
14.9%
Immigrants | Western Africa
0.8
/100
|
#248
Tragic
14.9%
Immigrants | Haiti
0.5
/100
|
#249
Tragic
15.0%
Immigrants | El Salvador
0.5
/100
|
#250
Tragic
15.0%
Haitians
0.5
/100
|
#251
Tragic
15.0%
Belizeans
0.4
/100
|
#252
Tragic
15.1%
Immigrants | West Indies
0.4
/100
|
#253
Tragic
15.1%
Somalis
0.4
/100
|
#254
Tragic
15.1%

Demographics Similar to Immigrants from Japan by Female Poverty Among 25-34 Year Olds

In terms of female poverty among 25-34 year olds, the demographic groups most similar to Immigrants from Japan are Cypriot (11.5%, a difference of 0.29%), Immigrants from Asia (11.6%, a difference of 0.30%), Bulgarian (11.5%, a difference of 0.31%), Immigrants from Pakistan (11.5%, a difference of 0.32%), and Immigrants from Greece (11.5%, a difference of 0.55%).
DemographicsRating | RankFemale Poverty Among 25-34 Year Olds
Maltese
99.9
/100
|
#24
Exceptional
11.4%
Bhutanese
99.9
/100
|
#25
Exceptional
11.4%
Tongans
99.9
/100
|
#26
Exceptional
11.5%
Immigrants | Greece
99.9
/100
|
#27
Exceptional
11.5%
Immigrants | Pakistan
99.9
/100
|
#28
Exceptional
11.5%
Bulgarians
99.9
/100
|
#29
Exceptional
11.5%
Cypriots
99.9
/100
|
#30
Exceptional
11.5%
Immigrants | Japan
99.9
/100
|
#31
Exceptional
11.6%
Immigrants | Asia
99.9
/100
|
#32
Exceptional
11.6%
Immigrants | Poland
99.9
/100
|
#33
Exceptional
11.6%
Zimbabweans
99.9
/100
|
#34
Exceptional
11.7%
Cambodians
99.9
/100
|
#35
Exceptional
11.7%
Immigrants | Sri Lanka
99.8
/100
|
#36
Exceptional
11.8%
Taiwanese
99.8
/100
|
#37
Exceptional
11.8%
Immigrants | North Macedonia
99.8
/100
|
#38
Exceptional
11.8%