Immigrants from Caribbean vs Immigrants from Japan Female Poverty Among 25-34 Year Olds
COMPARE
Immigrants from Caribbean
Immigrants from Japan
Female Poverty Among 25-34 Year Olds
Female Poverty Among 25-34 Year Olds Comparison
Immigrants from Caribbean
Immigrants from Japan
15.7%
FEMALE POVERTY AMONG 25-34 YEAR OLDS
0.0/ 100
METRIC RATING
274th/ 347
METRIC RANK
11.6%
FEMALE POVERTY AMONG 25-34 YEAR OLDS
99.9/ 100
METRIC RATING
31st/ 347
METRIC RANK
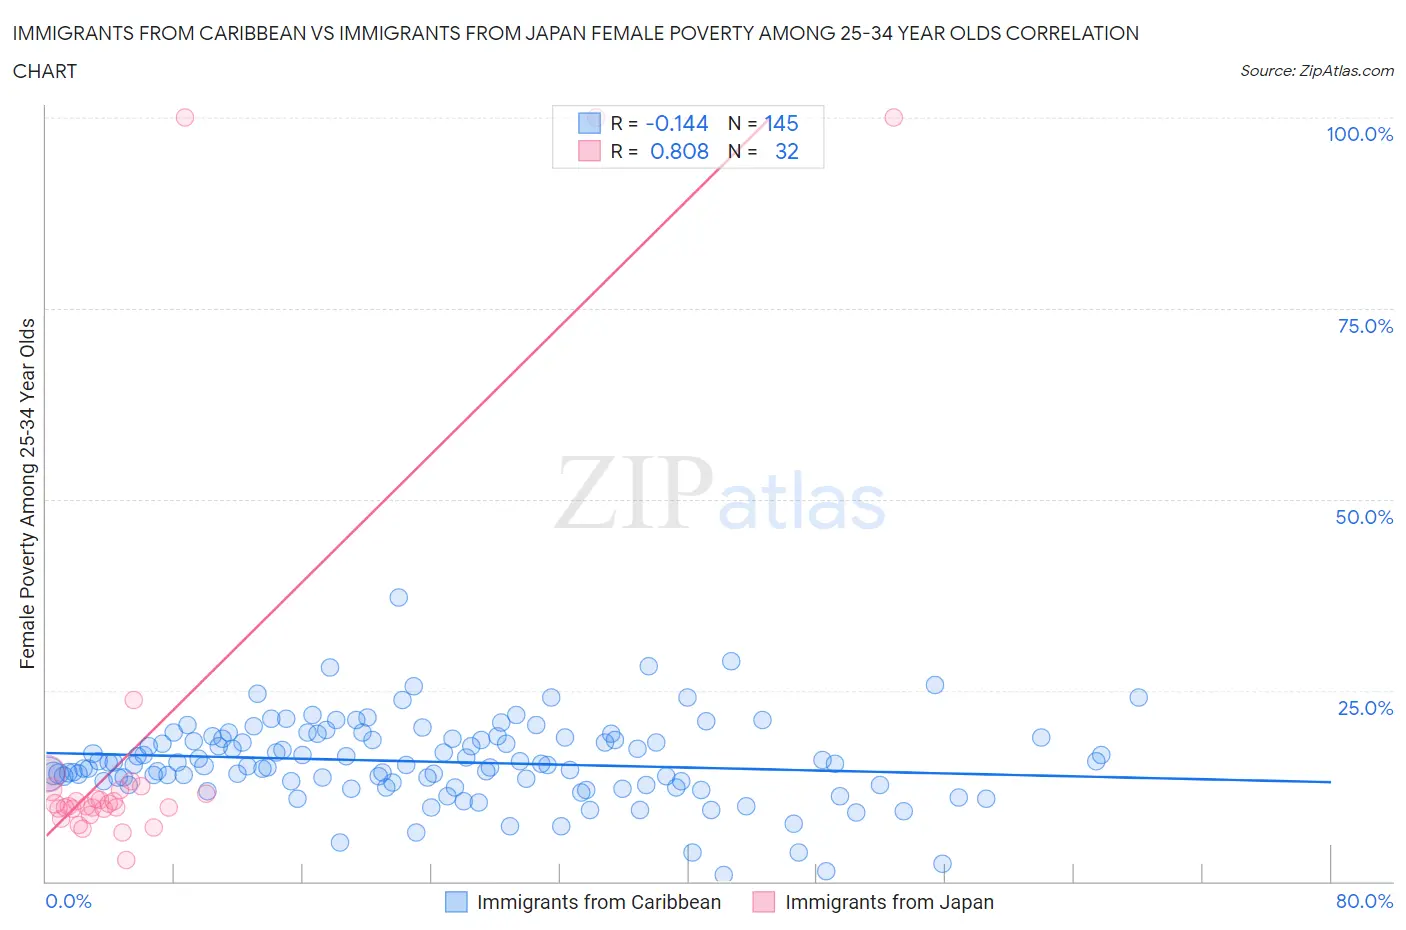
Immigrants from Caribbean vs Immigrants from Japan Female Poverty Among 25-34 Year Olds Correlation Chart
The statistical analysis conducted on geographies consisting of 441,382,759 people shows a poor negative correlation between the proportion of Immigrants from Caribbean and poverty level among females between the ages 25 and 34 in the United States with a correlation coefficient (R) of -0.144 and weighted average of 15.7%. Similarly, the statistical analysis conducted on geographies consisting of 335,631,961 people shows a very strong positive correlation between the proportion of Immigrants from Japan and poverty level among females between the ages 25 and 34 in the United States with a correlation coefficient (R) of 0.808 and weighted average of 11.6%, a difference of 35.9%.
Female Poverty Among 25-34 Year Olds Correlation Summary
| Measurement | Immigrants from Caribbean | Immigrants from Japan |
| Minimum | 0.81% | 2.8% |
| Maximum | 37.1% | 100.0% |
| Range | 36.3% | 97.3% |
| Mean | 15.6% | 18.6% |
| Median | 15.2% | 10.0% |
| Interquartile 25% (IQ1) | 12.8% | 9.4% |
| Interquartile 75% (IQ3) | 18.7% | 12.0% |
| Interquartile Range (IQR) | 5.9% | 2.5% |
| Standard Deviation (Sample) | 5.4% | 26.8% |
| Standard Deviation (Population) | 5.3% | 26.4% |
Similar Demographics by Female Poverty Among 25-34 Year Olds
Demographics Similar to Immigrants from Caribbean by Female Poverty Among 25-34 Year Olds
In terms of female poverty among 25-34 year olds, the demographic groups most similar to Immigrants from Caribbean are Immigrants from the Azores (15.8%, a difference of 0.35%), Nonimmigrants (15.6%, a difference of 0.49%), Senegalese (15.6%, a difference of 0.60%), Cree (15.6%, a difference of 0.66%), and British West Indian (15.6%, a difference of 0.67%).
| Demographics | Rating | Rank | Female Poverty Among 25-34 Year Olds |
| Central Americans | 0.1 /100 | #267 | Tragic 15.5% |
| Immigrants | Senegal | 0.1 /100 | #268 | Tragic 15.6% |
| Sub-Saharan Africans | 0.1 /100 | #269 | Tragic 15.6% |
| British West Indians | 0.1 /100 | #270 | Tragic 15.6% |
| Cree | 0.1 /100 | #271 | Tragic 15.6% |
| Senegalese | 0.1 /100 | #272 | Tragic 15.6% |
| Immigrants | Nonimmigrants | 0.1 /100 | #273 | Tragic 15.6% |
| Immigrants | Caribbean | 0.0 /100 | #274 | Tragic 15.7% |
| Immigrants | Azores | 0.0 /100 | #275 | Tragic 15.8% |
| Immigrants | Zaire | 0.0 /100 | #276 | Tragic 15.8% |
| Immigrants | Micronesia | 0.0 /100 | #277 | Tragic 15.8% |
| French American Indians | 0.0 /100 | #278 | Tragic 15.9% |
| Fijians | 0.0 /100 | #279 | Tragic 15.9% |
| Bangladeshis | 0.0 /100 | #280 | Tragic 15.9% |
| Immigrants | Latin America | 0.0 /100 | #281 | Tragic 16.0% |
Demographics Similar to Immigrants from Japan by Female Poverty Among 25-34 Year Olds
In terms of female poverty among 25-34 year olds, the demographic groups most similar to Immigrants from Japan are Cypriot (11.5%, a difference of 0.29%), Immigrants from Asia (11.6%, a difference of 0.30%), Bulgarian (11.5%, a difference of 0.31%), Immigrants from Pakistan (11.5%, a difference of 0.32%), and Immigrants from Greece (11.5%, a difference of 0.55%).
| Demographics | Rating | Rank | Female Poverty Among 25-34 Year Olds |
| Maltese | 99.9 /100 | #24 | Exceptional 11.4% |
| Bhutanese | 99.9 /100 | #25 | Exceptional 11.4% |
| Tongans | 99.9 /100 | #26 | Exceptional 11.5% |
| Immigrants | Greece | 99.9 /100 | #27 | Exceptional 11.5% |
| Immigrants | Pakistan | 99.9 /100 | #28 | Exceptional 11.5% |
| Bulgarians | 99.9 /100 | #29 | Exceptional 11.5% |
| Cypriots | 99.9 /100 | #30 | Exceptional 11.5% |
| Immigrants | Japan | 99.9 /100 | #31 | Exceptional 11.6% |
| Immigrants | Asia | 99.9 /100 | #32 | Exceptional 11.6% |
| Immigrants | Poland | 99.9 /100 | #33 | Exceptional 11.6% |
| Zimbabweans | 99.9 /100 | #34 | Exceptional 11.7% |
| Cambodians | 99.9 /100 | #35 | Exceptional 11.7% |
| Immigrants | Sri Lanka | 99.8 /100 | #36 | Exceptional 11.8% |
| Taiwanese | 99.8 /100 | #37 | Exceptional 11.8% |
| Immigrants | North Macedonia | 99.8 /100 | #38 | Exceptional 11.8% |