Immigrants from Bulgaria vs Hopi Vision Disability
COMPARE
Immigrants from Bulgaria
Hopi
Vision Disability
Vision Disability Comparison
Immigrants from Bulgaria
Hopi
2.0%
VISION DISABILITY
99.7/ 100
METRIC RATING
47th/ 347
METRIC RANK
2.9%
VISION DISABILITY
0.0/ 100
METRIC RATING
324th/ 347
METRIC RANK
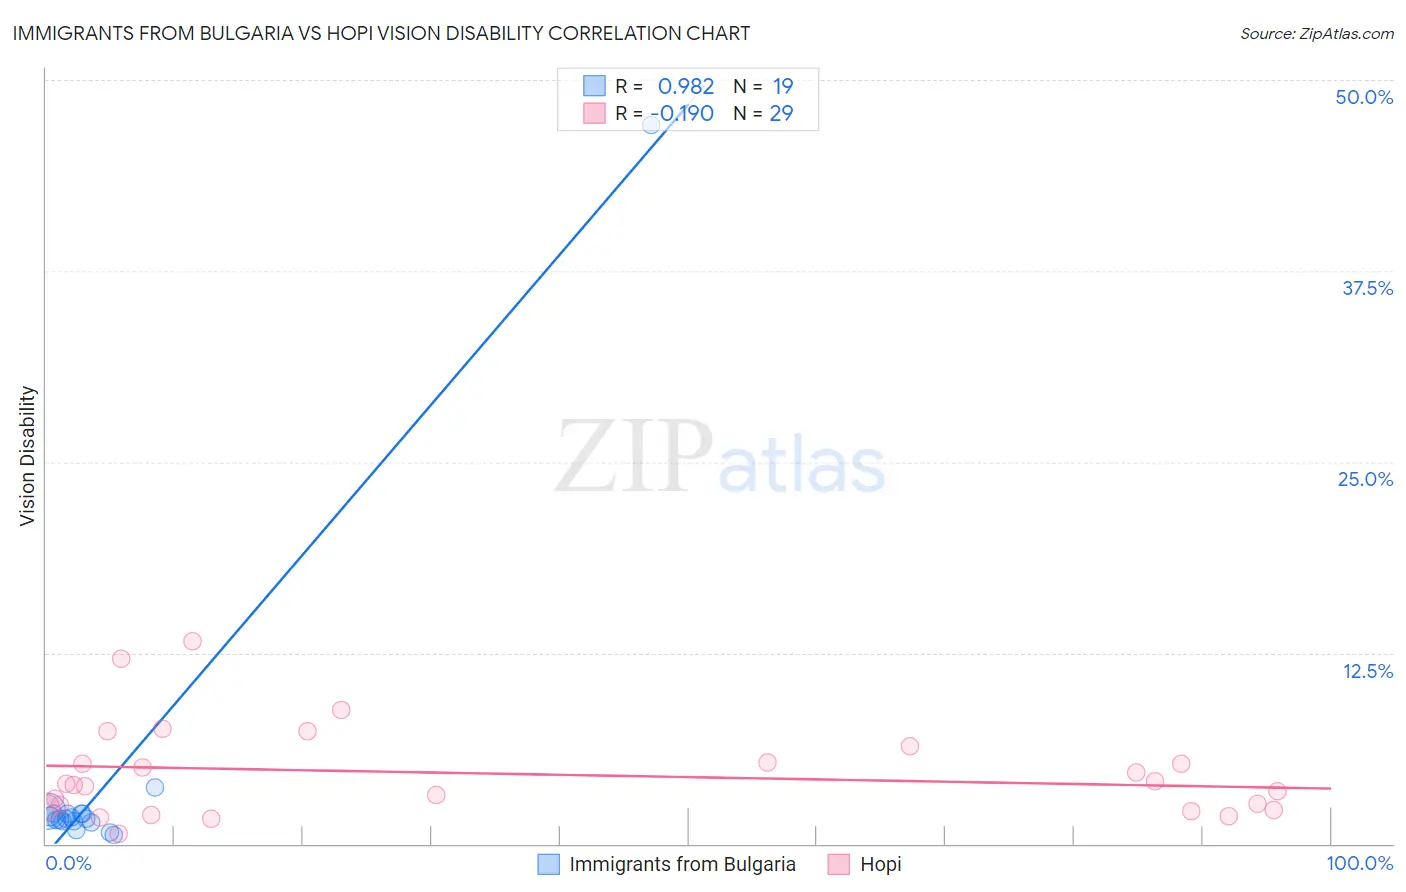
Immigrants from Bulgaria vs Hopi Vision Disability Correlation Chart
The statistical analysis conducted on geographies consisting of 172,526,022 people shows a perfect positive correlation between the proportion of Immigrants from Bulgaria and percentage of population with vision disability in the United States with a correlation coefficient (R) of 0.982 and weighted average of 2.0%. Similarly, the statistical analysis conducted on geographies consisting of 74,725,197 people shows a poor negative correlation between the proportion of Hopi and percentage of population with vision disability in the United States with a correlation coefficient (R) of -0.190 and weighted average of 2.9%, a difference of 47.5%.
Vision Disability Correlation Summary
| Measurement | Immigrants from Bulgaria | Hopi |
| Minimum | 0.56% | 0.64% |
| Maximum | 47.1% | 13.3% |
| Range | 46.5% | 12.6% |
| Mean | 4.1% | 4.6% |
| Median | 1.6% | 3.8% |
| Interquartile 25% (IQ1) | 1.5% | 2.3% |
| Interquartile 75% (IQ3) | 2.0% | 5.9% |
| Interquartile Range (IQR) | 0.48% | 3.6% |
| Standard Deviation (Sample) | 10.4% | 3.0% |
| Standard Deviation (Population) | 10.2% | 3.0% |
Similar Demographics by Vision Disability
Demographics Similar to Immigrants from Bulgaria by Vision Disability
In terms of vision disability, the demographic groups most similar to Immigrants from Bulgaria are Immigrants from Sweden (2.0%, a difference of 0.020%), Ethiopian (2.0%, a difference of 0.060%), Immigrants from Indonesia (2.0%, a difference of 0.090%), Eastern European (2.0%, a difference of 0.11%), and Immigrants from Ethiopia (2.0%, a difference of 0.17%).
| Demographics | Rating | Rank | Vision Disability |
| Immigrants | Ireland | 99.7 /100 | #40 | Exceptional 2.0% |
| Cypriots | 99.7 /100 | #41 | Exceptional 2.0% |
| Immigrants | Ethiopia | 99.7 /100 | #42 | Exceptional 2.0% |
| Eastern Europeans | 99.7 /100 | #43 | Exceptional 2.0% |
| Immigrants | Indonesia | 99.7 /100 | #44 | Exceptional 2.0% |
| Ethiopians | 99.7 /100 | #45 | Exceptional 2.0% |
| Immigrants | Sweden | 99.7 /100 | #46 | Exceptional 2.0% |
| Immigrants | Bulgaria | 99.7 /100 | #47 | Exceptional 2.0% |
| Israelis | 99.6 /100 | #48 | Exceptional 2.0% |
| Latvians | 99.5 /100 | #49 | Exceptional 2.0% |
| Afghans | 99.5 /100 | #50 | Exceptional 2.0% |
| Tongans | 99.5 /100 | #51 | Exceptional 2.0% |
| Immigrants | Serbia | 99.4 /100 | #52 | Exceptional 2.0% |
| Immigrants | Belarus | 99.3 /100 | #53 | Exceptional 2.0% |
| Macedonians | 99.3 /100 | #54 | Exceptional 2.0% |
Demographics Similar to Hopi by Vision Disability
In terms of vision disability, the demographic groups most similar to Hopi are Cherokee (2.9%, a difference of 0.010%), Spanish American (2.9%, a difference of 1.2%), Paiute (2.9%, a difference of 2.0%), Tlingit-Haida (2.9%, a difference of 2.0%), and Native/Alaskan (3.0%, a difference of 2.0%).
| Demographics | Rating | Rank | Vision Disability |
| Yup'ik | 0.0 /100 | #317 | Tragic 2.7% |
| Alaska Natives | 0.0 /100 | #318 | Tragic 2.7% |
| Tohono O'odham | 0.0 /100 | #319 | Tragic 2.8% |
| Blacks/African Americans | 0.0 /100 | #320 | Tragic 2.8% |
| Comanche | 0.0 /100 | #321 | Tragic 2.8% |
| Paiute | 0.0 /100 | #322 | Tragic 2.9% |
| Tlingit-Haida | 0.0 /100 | #323 | Tragic 2.9% |
| Hopi | 0.0 /100 | #324 | Tragic 2.9% |
| Cherokee | 0.0 /100 | #325 | Tragic 2.9% |
| Spanish Americans | 0.0 /100 | #326 | Tragic 2.9% |
| Natives/Alaskans | 0.0 /100 | #327 | Tragic 3.0% |
| Yuman | 0.0 /100 | #328 | Tragic 3.0% |
| Apache | 0.0 /100 | #329 | Tragic 3.0% |
| Colville | 0.0 /100 | #330 | Tragic 3.0% |
| Central American Indians | 0.0 /100 | #331 | Tragic 3.0% |