Immigrants from Bulgaria vs Immigrants from Central America Poverty
COMPARE
Immigrants from Bulgaria
Immigrants from Central America
Poverty
Poverty Comparison
Immigrants from Bulgaria
Immigrants from Central America
11.1%
POVERTY
98.5/ 100
METRIC RATING
54th/ 347
METRIC RANK
15.4%
POVERTY
0.0/ 100
METRIC RATING
300th/ 347
METRIC RANK
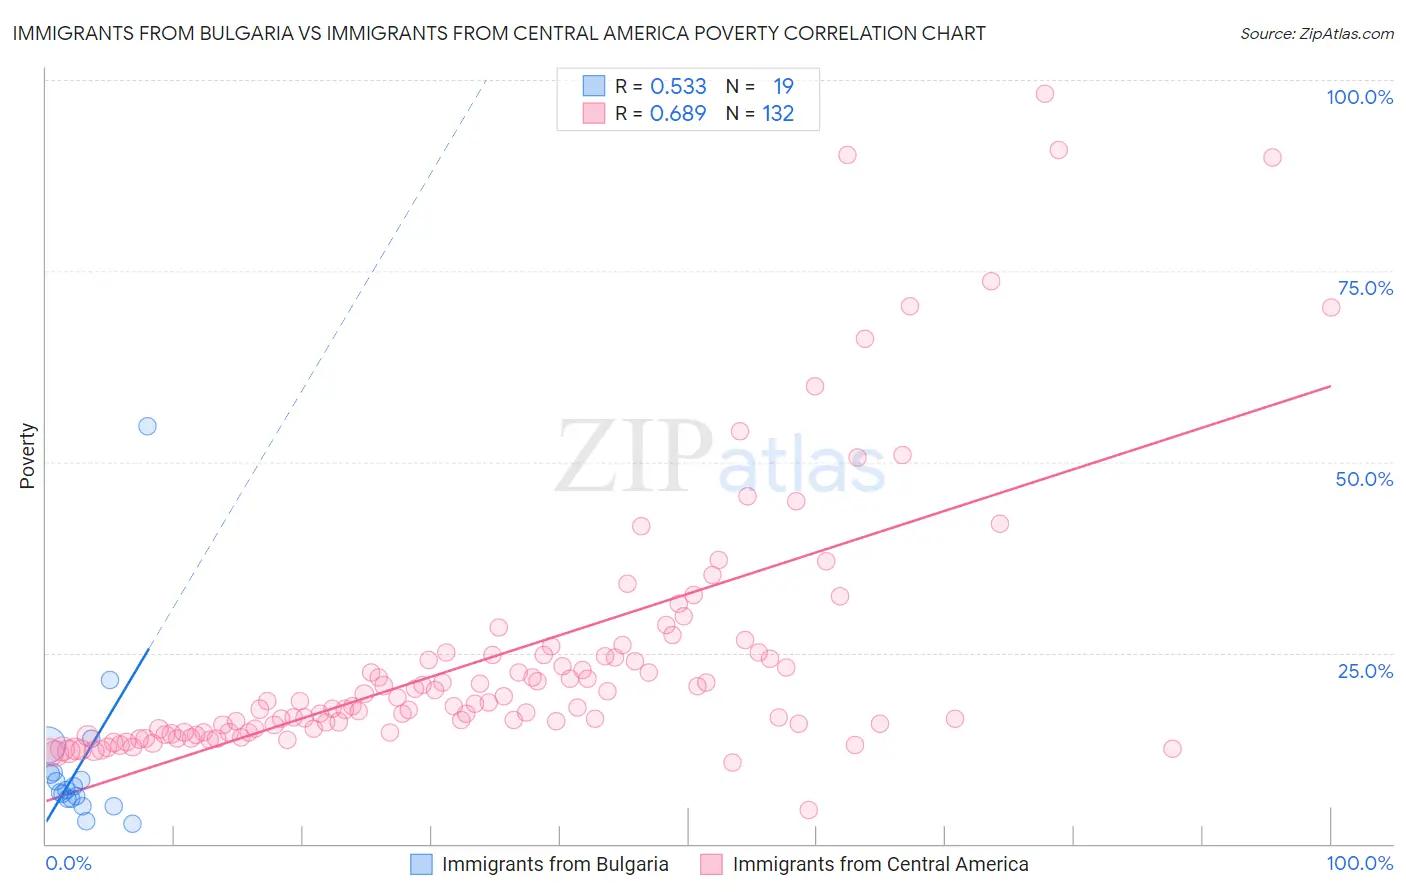
Immigrants from Bulgaria vs Immigrants from Central America Poverty Correlation Chart
The statistical analysis conducted on geographies consisting of 172,536,486 people shows a substantial positive correlation between the proportion of Immigrants from Bulgaria and poverty level in the United States with a correlation coefficient (R) of 0.533 and weighted average of 11.1%. Similarly, the statistical analysis conducted on geographies consisting of 536,001,956 people shows a significant positive correlation between the proportion of Immigrants from Central America and poverty level in the United States with a correlation coefficient (R) of 0.689 and weighted average of 15.4%, a difference of 38.8%.
Poverty Correlation Summary
| Measurement | Immigrants from Bulgaria | Immigrants from Central America |
| Minimum | 2.7% | 4.4% |
| Maximum | 54.7% | 98.2% |
| Range | 52.0% | 93.8% |
| Mean | 10.5% | 24.4% |
| Median | 7.0% | 18.2% |
| Interquartile 25% (IQ1) | 5.8% | 14.5% |
| Interquartile 75% (IQ3) | 9.4% | 24.7% |
| Interquartile Range (IQR) | 3.5% | 10.2% |
| Standard Deviation (Sample) | 11.5% | 17.4% |
| Standard Deviation (Population) | 11.2% | 17.3% |
Similar Demographics by Poverty
Demographics Similar to Immigrants from Bulgaria by Poverty
In terms of poverty, the demographic groups most similar to Immigrants from Bulgaria are Immigrants from Serbia (11.1%, a difference of 0.030%), Immigrants from Austria (11.1%, a difference of 0.12%), Immigrants from Philippines (11.0%, a difference of 0.34%), Immigrants from Croatia (11.0%, a difference of 0.36%), and Estonian (11.1%, a difference of 0.51%).
| Demographics | Rating | Rank | Poverty |
| Immigrants | Romania | 98.9 /100 | #47 | Exceptional 11.0% |
| Slovenes | 98.9 /100 | #48 | Exceptional 11.0% |
| Immigrants | Japan | 98.9 /100 | #49 | Exceptional 11.0% |
| Asians | 98.9 /100 | #50 | Exceptional 11.0% |
| Immigrants | Croatia | 98.7 /100 | #51 | Exceptional 11.0% |
| Immigrants | Philippines | 98.7 /100 | #52 | Exceptional 11.0% |
| Immigrants | Austria | 98.6 /100 | #53 | Exceptional 11.1% |
| Immigrants | Bulgaria | 98.5 /100 | #54 | Exceptional 11.1% |
| Immigrants | Serbia | 98.5 /100 | #55 | Exceptional 11.1% |
| Estonians | 98.2 /100 | #56 | Exceptional 11.1% |
| Scandinavians | 98.2 /100 | #57 | Exceptional 11.1% |
| Germans | 98.1 /100 | #58 | Exceptional 11.1% |
| Immigrants | Europe | 98.0 /100 | #59 | Exceptional 11.2% |
| Immigrants | Sri Lanka | 97.9 /100 | #60 | Exceptional 11.2% |
| Immigrants | Italy | 97.9 /100 | #61 | Exceptional 11.2% |
Demographics Similar to Immigrants from Central America by Poverty
In terms of poverty, the demographic groups most similar to Immigrants from Central America are Bahamian (15.4%, a difference of 0.21%), Somali (15.4%, a difference of 0.34%), Senegalese (15.3%, a difference of 0.38%), Immigrants from Senegal (15.3%, a difference of 0.47%), and Immigrants from Bangladesh (15.3%, a difference of 0.62%).
| Demographics | Rating | Rank | Poverty |
| Immigrants | Zaire | 0.0 /100 | #293 | Tragic 15.1% |
| Blackfeet | 0.0 /100 | #294 | Tragic 15.2% |
| Guatemalans | 0.0 /100 | #295 | Tragic 15.3% |
| Hispanics or Latinos | 0.0 /100 | #296 | Tragic 15.3% |
| Immigrants | Bangladesh | 0.0 /100 | #297 | Tragic 15.3% |
| Immigrants | Senegal | 0.0 /100 | #298 | Tragic 15.3% |
| Senegalese | 0.0 /100 | #299 | Tragic 15.3% |
| Immigrants | Central America | 0.0 /100 | #300 | Tragic 15.4% |
| Bahamians | 0.0 /100 | #301 | Tragic 15.4% |
| Somalis | 0.0 /100 | #302 | Tragic 15.4% |
| Immigrants | Caribbean | 0.0 /100 | #303 | Tragic 15.5% |
| Immigrants | Mexico | 0.0 /100 | #304 | Tragic 15.5% |
| Immigrants | Guatemala | 0.0 /100 | #305 | Tragic 15.5% |
| Creek | 0.0 /100 | #306 | Tragic 15.6% |
| Africans | 0.0 /100 | #307 | Tragic 15.6% |