Immigrants from Brazil vs Immigrants from Korea Single Male Poverty
COMPARE
Immigrants from Brazil
Immigrants from Korea
Single Male Poverty
Single Male Poverty Comparison
Immigrants from Brazil
Immigrants from Korea
11.7%
SINGLE MALE POVERTY
99.8/ 100
METRIC RATING
58th/ 347
METRIC RANK
11.5%
SINGLE MALE POVERTY
100.0/ 100
METRIC RATING
40th/ 347
METRIC RANK
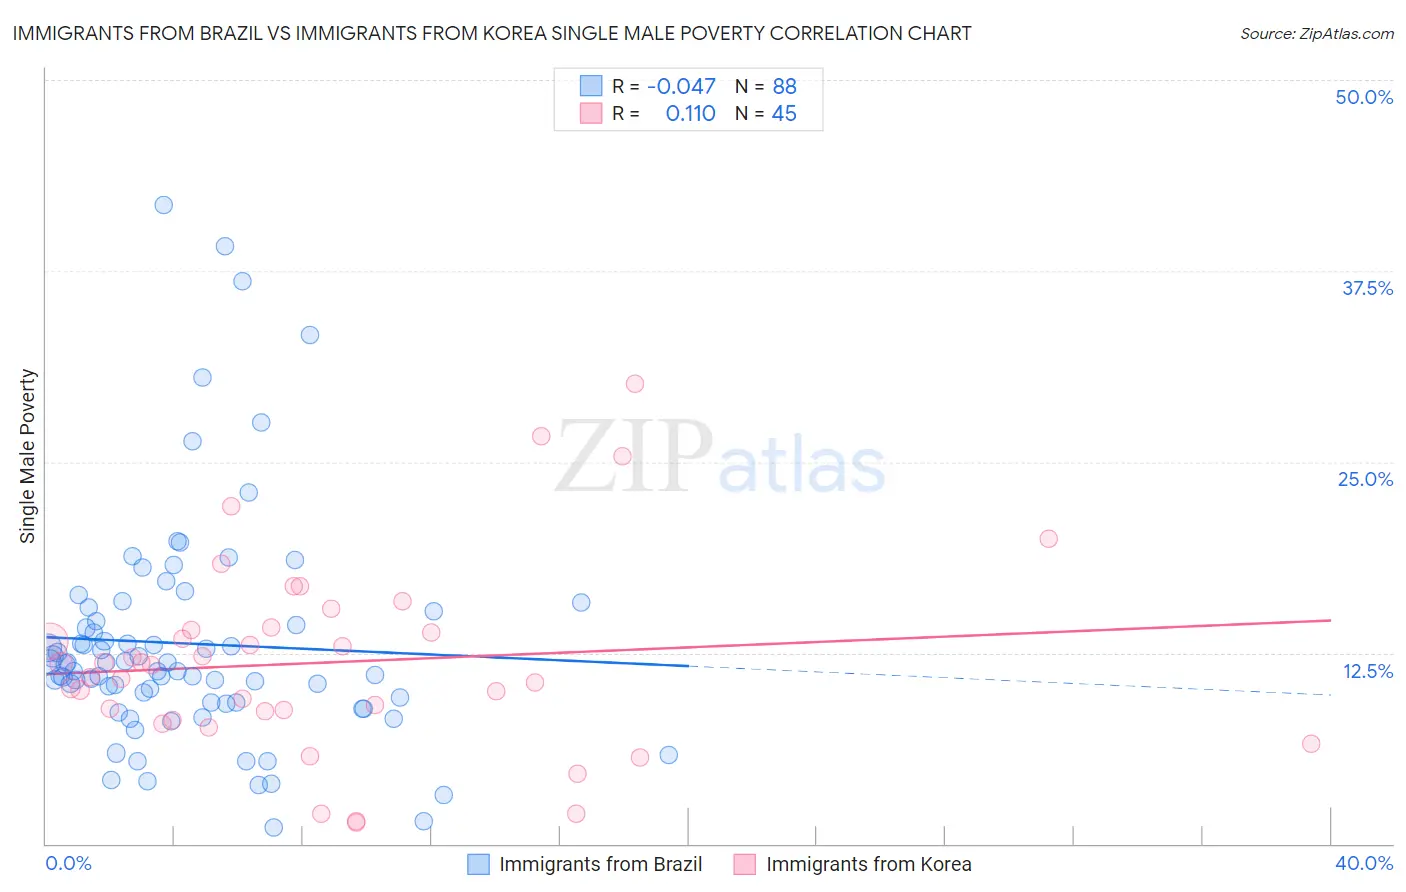
Immigrants from Brazil vs Immigrants from Korea Single Male Poverty Correlation Chart
The statistical analysis conducted on geographies consisting of 304,479,372 people shows no correlation between the proportion of Immigrants from Brazil and poverty level among single males in the United States with a correlation coefficient (R) of -0.047 and weighted average of 11.7%. Similarly, the statistical analysis conducted on geographies consisting of 364,058,010 people shows a poor positive correlation between the proportion of Immigrants from Korea and poverty level among single males in the United States with a correlation coefficient (R) of 0.110 and weighted average of 11.5%, a difference of 2.1%.
Single Male Poverty Correlation Summary
| Measurement | Immigrants from Brazil | Immigrants from Korea |
| Minimum | 1.1% | 1.4% |
| Maximum | 41.8% | 30.1% |
| Range | 40.8% | 28.7% |
| Mean | 13.1% | 11.9% |
| Median | 11.5% | 11.7% |
| Interquartile 25% (IQ1) | 9.3% | 8.4% |
| Interquartile 75% (IQ3) | 14.9% | 14.1% |
| Interquartile Range (IQR) | 5.6% | 5.7% |
| Standard Deviation (Sample) | 7.5% | 6.3% |
| Standard Deviation (Population) | 7.5% | 6.2% |
Demographics Similar to Immigrants from Brazil and Immigrants from Korea by Single Male Poverty
In terms of single male poverty, the demographic groups most similar to Immigrants from Brazil are Immigrants from Romania (11.7%, a difference of 0.020%), Brazilian (11.8%, a difference of 0.080%), Burmese (11.7%, a difference of 0.17%), Cypriot (11.7%, a difference of 0.48%), and Immigrants from Uzbekistan (11.7%, a difference of 0.66%). Similarly, the demographic groups most similar to Immigrants from Korea are Immigrants from Iraq (11.5%, a difference of 0.15%), Egyptian (11.5%, a difference of 0.20%), Soviet Union (11.5%, a difference of 0.33%), Immigrants from Peru (11.5%, a difference of 0.36%), and Immigrants from Cameroon (11.5%, a difference of 0.37%).
| Demographics | Rating | Rank | Single Male Poverty |
| Soviet Union | 100.0 /100 | #39 | Exceptional 11.5% |
| Immigrants | Korea | 100.0 /100 | #40 | Exceptional 11.5% |
| Immigrants | Iraq | 99.9 /100 | #41 | Exceptional 11.5% |
| Egyptians | 99.9 /100 | #42 | Exceptional 11.5% |
| Immigrants | Peru | 99.9 /100 | #43 | Exceptional 11.5% |
| Immigrants | Cameroon | 99.9 /100 | #44 | Exceptional 11.5% |
| Immigrants | Poland | 99.9 /100 | #45 | Exceptional 11.5% |
| Immigrants | Bulgaria | 99.9 /100 | #46 | Exceptional 11.6% |
| Nepalese | 99.9 /100 | #47 | Exceptional 11.6% |
| Immigrants | Indonesia | 99.9 /100 | #48 | Exceptional 11.6% |
| Tlingit-Haida | 99.9 /100 | #49 | Exceptional 11.6% |
| Immigrants | Lithuania | 99.9 /100 | #50 | Exceptional 11.6% |
| Paraguayans | 99.9 /100 | #51 | Exceptional 11.6% |
| Samoans | 99.9 /100 | #52 | Exceptional 11.7% |
| Bulgarians | 99.9 /100 | #53 | Exceptional 11.7% |
| Immigrants | Uzbekistan | 99.9 /100 | #54 | Exceptional 11.7% |
| Cypriots | 99.9 /100 | #55 | Exceptional 11.7% |
| Burmese | 99.8 /100 | #56 | Exceptional 11.7% |
| Immigrants | Romania | 99.8 /100 | #57 | Exceptional 11.7% |
| Immigrants | Brazil | 99.8 /100 | #58 | Exceptional 11.7% |
| Brazilians | 99.8 /100 | #59 | Exceptional 11.8% |