Immigrants from Bolivia vs Hmong Child Poverty Under the Age of 16
COMPARE
Immigrants from Bolivia
Hmong
Child Poverty Under the Age of 16
Child Poverty Under the Age of 16 Comparison
Immigrants from Bolivia
Hmong
13.6%
CHILD POVERTY UNDER THE AGE OF 16
99.6/ 100
METRIC RATING
37th/ 347
METRIC RANK
17.1%
CHILD POVERTY UNDER THE AGE OF 16
14.0/ 100
METRIC RATING
204th/ 347
METRIC RANK
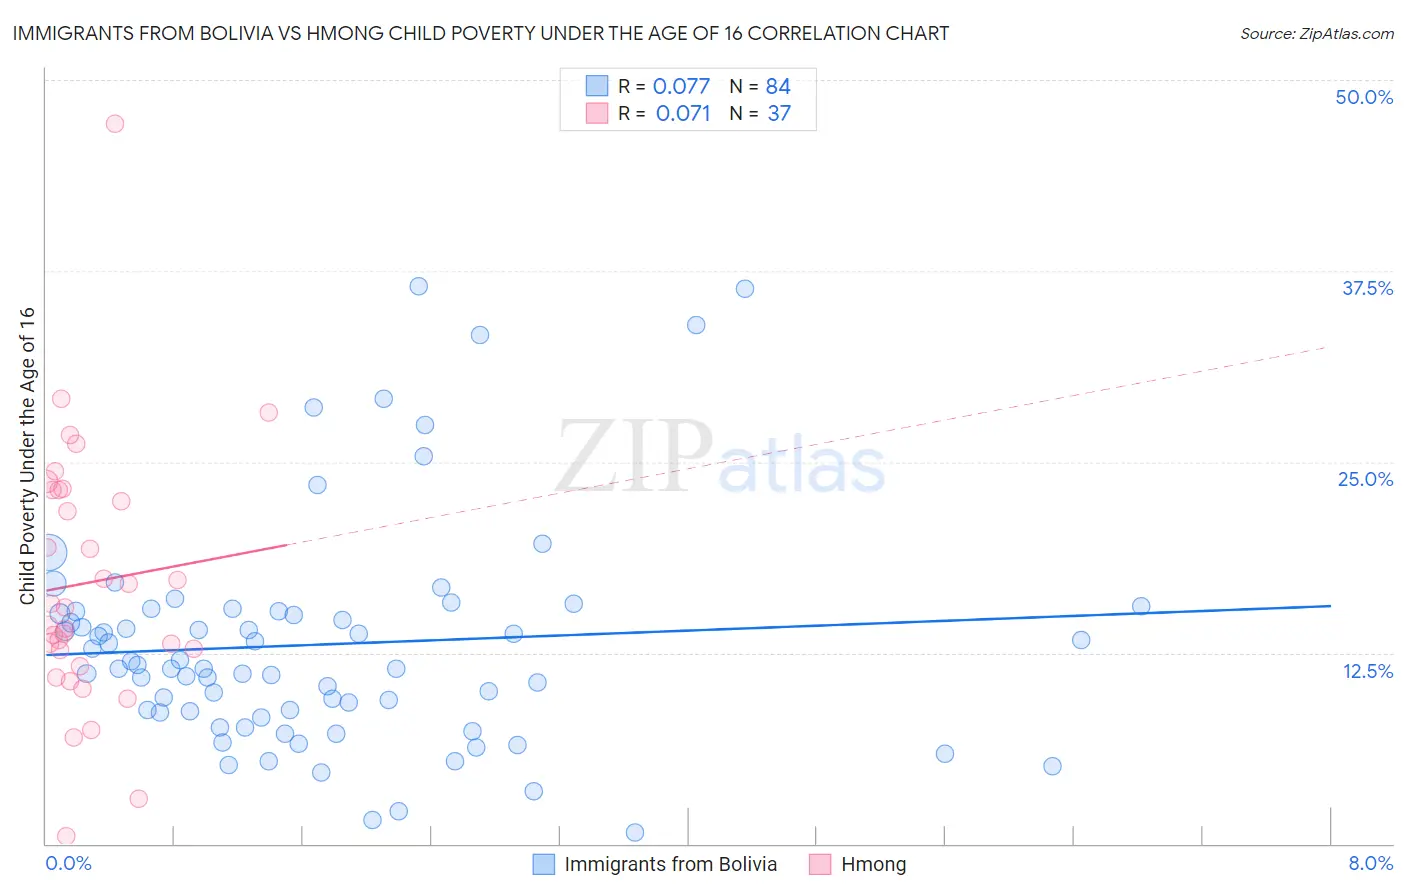
Immigrants from Bolivia vs Hmong Child Poverty Under the Age of 16 Correlation Chart
The statistical analysis conducted on geographies consisting of 158,228,551 people shows a slight positive correlation between the proportion of Immigrants from Bolivia and poverty level among children under the age of 16 in the United States with a correlation coefficient (R) of 0.077 and weighted average of 13.6%. Similarly, the statistical analysis conducted on geographies consisting of 24,652,508 people shows a slight positive correlation between the proportion of Hmong and poverty level among children under the age of 16 in the United States with a correlation coefficient (R) of 0.071 and weighted average of 17.1%, a difference of 26.0%.
Child Poverty Under the Age of 16 Correlation Summary
| Measurement | Immigrants from Bolivia | Hmong |
| Minimum | 0.74% | 0.48% |
| Maximum | 36.5% | 47.2% |
| Range | 35.8% | 46.7% |
| Mean | 13.1% | 17.1% |
| Median | 11.6% | 15.5% |
| Interquartile 25% (IQ1) | 8.6% | 12.1% |
| Interquartile 75% (IQ3) | 15.2% | 23.2% |
| Interquartile Range (IQR) | 6.6% | 11.0% |
| Standard Deviation (Sample) | 7.4% | 8.6% |
| Standard Deviation (Population) | 7.3% | 8.4% |
Similar Demographics by Child Poverty Under the Age of 16
Demographics Similar to Immigrants from Bolivia by Child Poverty Under the Age of 16
In terms of child poverty under the age of 16, the demographic groups most similar to Immigrants from Bolivia are Immigrants from Northern Europe (13.6%, a difference of 0.010%), Lithuanian (13.5%, a difference of 0.26%), Russian (13.5%, a difference of 0.46%), Luxembourger (13.6%, a difference of 0.51%), and Immigrants from Australia (13.6%, a difference of 0.54%).
| Demographics | Rating | Rank | Child Poverty Under the Age of 16 |
| Turks | 99.7 /100 | #30 | Exceptional 13.4% |
| Danes | 99.7 /100 | #31 | Exceptional 13.4% |
| Tongans | 99.7 /100 | #32 | Exceptional 13.4% |
| Asians | 99.6 /100 | #33 | Exceptional 13.5% |
| Russians | 99.6 /100 | #34 | Exceptional 13.5% |
| Lithuanians | 99.6 /100 | #35 | Exceptional 13.5% |
| Immigrants | Northern Europe | 99.6 /100 | #36 | Exceptional 13.6% |
| Immigrants | Bolivia | 99.6 /100 | #37 | Exceptional 13.6% |
| Luxembourgers | 99.5 /100 | #38 | Exceptional 13.6% |
| Immigrants | Australia | 99.5 /100 | #39 | Exceptional 13.6% |
| Immigrants | Scotland | 99.4 /100 | #40 | Exceptional 13.7% |
| Croatians | 99.4 /100 | #41 | Exceptional 13.8% |
| Immigrants | Sri Lanka | 99.3 /100 | #42 | Exceptional 13.8% |
| Immigrants | Moldova | 99.3 /100 | #43 | Exceptional 13.8% |
| Greeks | 99.3 /100 | #44 | Exceptional 13.8% |
Demographics Similar to Hmong by Child Poverty Under the Age of 16
In terms of child poverty under the age of 16, the demographic groups most similar to Hmong are Aleut (17.1%, a difference of 0.010%), Immigrants from Sierra Leone (17.1%, a difference of 0.060%), Ugandan (17.1%, a difference of 0.080%), Immigrants from Uzbekistan (17.1%, a difference of 0.16%), and Immigrants from Cameroon (17.1%, a difference of 0.17%).
| Demographics | Rating | Rank | Child Poverty Under the Age of 16 |
| Immigrants | Kenya | 19.1 /100 | #197 | Poor 16.9% |
| Delaware | 17.1 /100 | #198 | Poor 17.0% |
| Immigrants | Afghanistan | 15.1 /100 | #199 | Poor 17.0% |
| Immigrants | Cameroon | 14.7 /100 | #200 | Poor 17.1% |
| Immigrants | Uzbekistan | 14.7 /100 | #201 | Poor 17.1% |
| Ugandans | 14.3 /100 | #202 | Poor 17.1% |
| Immigrants | Sierra Leone | 14.2 /100 | #203 | Poor 17.1% |
| Hmong | 14.0 /100 | #204 | Poor 17.1% |
| Aleuts | 13.9 /100 | #205 | Poor 17.1% |
| Alaska Natives | 11.8 /100 | #206 | Poor 17.2% |
| German Russians | 8.6 /100 | #207 | Tragic 17.4% |
| Pennsylvania Germans | 7.5 /100 | #208 | Tragic 17.4% |
| Panamanians | 6.9 /100 | #209 | Tragic 17.5% |
| Alaskan Athabascans | 6.9 /100 | #210 | Tragic 17.5% |
| Immigrants | Thailand | 6.6 /100 | #211 | Tragic 17.5% |