Immigrants from Belize vs Jamaican Family Poverty
COMPARE
Immigrants from Belize
Jamaican
Family Poverty
Family Poverty Comparison
Immigrants from Belize
Jamaicans
11.5%
FAMILY POVERTY
0.0/ 100
METRIC RATING
288th/ 347
METRIC RANK
11.1%
FAMILY POVERTY
0.1/ 100
METRIC RATING
268th/ 347
METRIC RANK
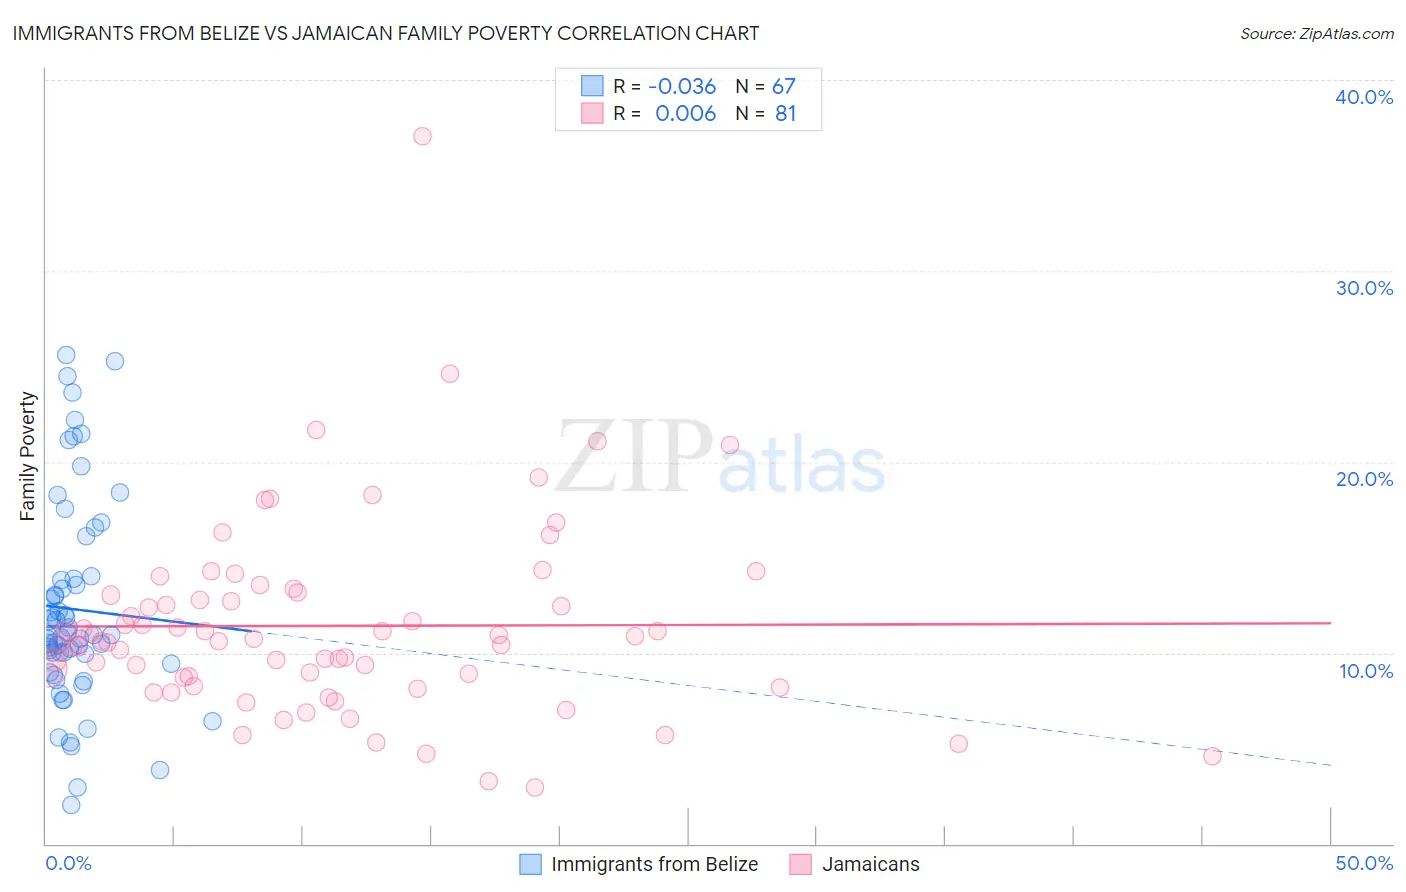
Immigrants from Belize vs Jamaican Family Poverty Correlation Chart
The statistical analysis conducted on geographies consisting of 130,249,442 people shows no correlation between the proportion of Immigrants from Belize and poverty level among families in the United States with a correlation coefficient (R) of -0.036 and weighted average of 11.5%. Similarly, the statistical analysis conducted on geographies consisting of 367,005,969 people shows no correlation between the proportion of Jamaicans and poverty level among families in the United States with a correlation coefficient (R) of 0.006 and weighted average of 11.1%, a difference of 4.1%.
Family Poverty Correlation Summary
| Measurement | Immigrants from Belize | Jamaican |
| Minimum | 2.0% | 3.0% |
| Maximum | 25.6% | 37.0% |
| Range | 23.6% | 34.1% |
| Mean | 12.3% | 11.4% |
| Median | 10.9% | 10.6% |
| Interquartile 25% (IQ1) | 9.4% | 8.5% |
| Interquartile 75% (IQ3) | 13.8% | 13.1% |
| Interquartile Range (IQR) | 4.4% | 4.6% |
| Standard Deviation (Sample) | 5.3% | 5.1% |
| Standard Deviation (Population) | 5.3% | 5.1% |
Demographics Similar to Immigrants from Belize and Jamaicans by Family Poverty
In terms of family poverty, the demographic groups most similar to Immigrants from Belize are Vietnamese (11.5%, a difference of 0.19%), Senegalese (11.5%, a difference of 0.46%), Barbadian (11.3%, a difference of 1.5%), Yaqui (11.3%, a difference of 1.6%), and Indonesian (11.3%, a difference of 1.7%). Similarly, the demographic groups most similar to Jamaicans are Immigrants from Ecuador (11.1%, a difference of 0.48%), Immigrants from Nicaragua (11.1%, a difference of 0.49%), Immigrants from Bahamas (11.1%, a difference of 0.73%), Immigrants from Jamaica (11.2%, a difference of 0.83%), and Somali (11.2%, a difference of 1.3%).
| Demographics | Rating | Rank | Family Poverty |
| Jamaicans | 0.1 /100 | #268 | Tragic 11.1% |
| Immigrants | Ecuador | 0.1 /100 | #269 | Tragic 11.1% |
| Immigrants | Nicaragua | 0.1 /100 | #270 | Tragic 11.1% |
| Immigrants | Bahamas | 0.1 /100 | #271 | Tragic 11.1% |
| Immigrants | Jamaica | 0.1 /100 | #272 | Tragic 11.2% |
| Somalis | 0.1 /100 | #273 | Tragic 11.2% |
| Spanish Americans | 0.1 /100 | #274 | Tragic 11.2% |
| Central Americans | 0.1 /100 | #275 | Tragic 11.2% |
| Immigrants | Guyana | 0.1 /100 | #276 | Tragic 11.2% |
| Chippewa | 0.1 /100 | #277 | Tragic 11.2% |
| Guyanese | 0.1 /100 | #278 | Tragic 11.2% |
| Blackfeet | 0.0 /100 | #279 | Tragic 11.3% |
| Belizeans | 0.0 /100 | #280 | Tragic 11.3% |
| Immigrants | West Indies | 0.0 /100 | #281 | Tragic 11.3% |
| Immigrants | Cuba | 0.0 /100 | #282 | Tragic 11.3% |
| Indonesians | 0.0 /100 | #283 | Tragic 11.3% |
| Yaqui | 0.0 /100 | #284 | Tragic 11.3% |
| Barbadians | 0.0 /100 | #285 | Tragic 11.3% |
| Senegalese | 0.0 /100 | #286 | Tragic 11.5% |
| Vietnamese | 0.0 /100 | #287 | Tragic 11.5% |
| Immigrants | Belize | 0.0 /100 | #288 | Tragic 11.5% |