Immigrants from Belize vs Immigrants from Saudi Arabia Family Poverty
COMPARE
Immigrants from Belize
Immigrants from Saudi Arabia
Family Poverty
Family Poverty Comparison
Immigrants from Belize
Immigrants from Saudi Arabia
11.5%
FAMILY POVERTY
0.0/ 100
METRIC RATING
288th/ 347
METRIC RANK
9.1%
FAMILY POVERTY
38.6/ 100
METRIC RATING
185th/ 347
METRIC RANK
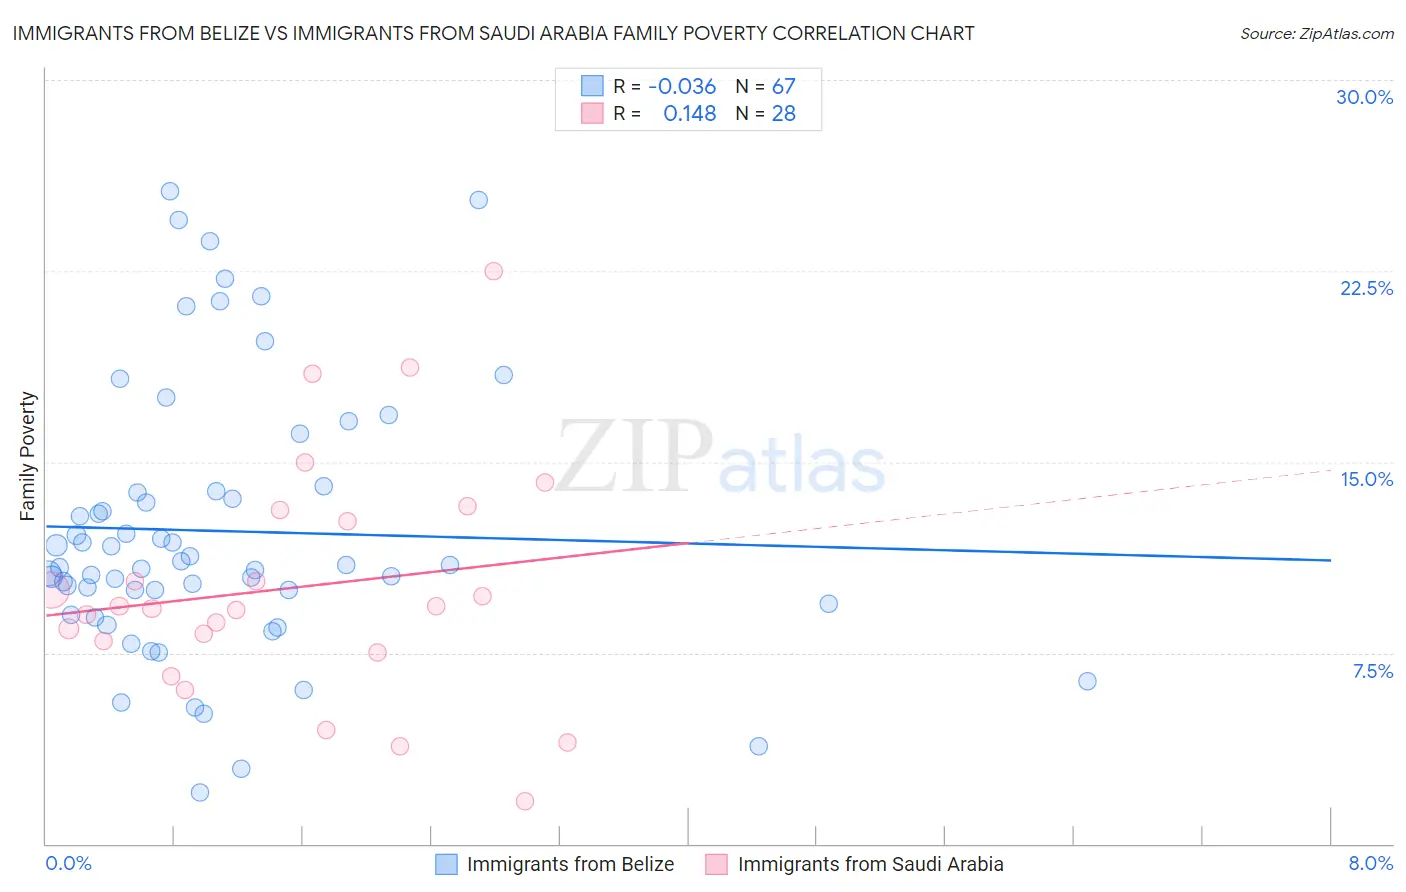
Immigrants from Belize vs Immigrants from Saudi Arabia Family Poverty Correlation Chart
The statistical analysis conducted on geographies consisting of 130,249,442 people shows no correlation between the proportion of Immigrants from Belize and poverty level among families in the United States with a correlation coefficient (R) of -0.036 and weighted average of 11.5%. Similarly, the statistical analysis conducted on geographies consisting of 164,117,419 people shows a poor positive correlation between the proportion of Immigrants from Saudi Arabia and poverty level among families in the United States with a correlation coefficient (R) of 0.148 and weighted average of 9.1%, a difference of 26.0%.
Family Poverty Correlation Summary
| Measurement | Immigrants from Belize | Immigrants from Saudi Arabia |
| Minimum | 2.0% | 1.7% |
| Maximum | 25.6% | 22.5% |
| Range | 23.6% | 20.8% |
| Mean | 12.3% | 10.1% |
| Median | 10.9% | 9.3% |
| Interquartile 25% (IQ1) | 9.4% | 7.7% |
| Interquartile 75% (IQ3) | 13.8% | 12.9% |
| Interquartile Range (IQR) | 4.4% | 5.2% |
| Standard Deviation (Sample) | 5.3% | 4.7% |
| Standard Deviation (Population) | 5.3% | 4.6% |
Similar Demographics by Family Poverty
Demographics Similar to Immigrants from Belize by Family Poverty
In terms of family poverty, the demographic groups most similar to Immigrants from Belize are Immigrants from Barbados (11.5%, a difference of 0.050%), West Indian (11.5%, a difference of 0.060%), Haitian (11.5%, a difference of 0.12%), Vietnamese (11.5%, a difference of 0.19%), and Immigrants from Somalia (11.5%, a difference of 0.22%).
| Demographics | Rating | Rank | Family Poverty |
| Immigrants | West Indies | 0.0 /100 | #281 | Tragic 11.3% |
| Immigrants | Cuba | 0.0 /100 | #282 | Tragic 11.3% |
| Indonesians | 0.0 /100 | #283 | Tragic 11.3% |
| Yaqui | 0.0 /100 | #284 | Tragic 11.3% |
| Barbadians | 0.0 /100 | #285 | Tragic 11.3% |
| Senegalese | 0.0 /100 | #286 | Tragic 11.5% |
| Vietnamese | 0.0 /100 | #287 | Tragic 11.5% |
| Immigrants | Belize | 0.0 /100 | #288 | Tragic 11.5% |
| Immigrants | Barbados | 0.0 /100 | #289 | Tragic 11.5% |
| West Indians | 0.0 /100 | #290 | Tragic 11.5% |
| Haitians | 0.0 /100 | #291 | Tragic 11.5% |
| Immigrants | Somalia | 0.0 /100 | #292 | Tragic 11.5% |
| Immigrants | Cabo Verde | 0.0 /100 | #293 | Tragic 11.6% |
| Immigrants | St. Vincent and the Grenadines | 0.0 /100 | #294 | Tragic 11.6% |
| Immigrants | Haiti | 0.0 /100 | #295 | Tragic 11.6% |
Demographics Similar to Immigrants from Saudi Arabia by Family Poverty
In terms of family poverty, the demographic groups most similar to Immigrants from Saudi Arabia are South American Indian (9.1%, a difference of 0.010%), Uruguayan (9.1%, a difference of 0.080%), Immigrants from Morocco (9.1%, a difference of 0.21%), Hmong (9.1%, a difference of 0.22%), and Colombian (9.2%, a difference of 0.35%).
| Demographics | Rating | Rank | Family Poverty |
| Immigrants | Cameroon | 47.1 /100 | #178 | Average 9.0% |
| Immigrants | Iraq | 44.4 /100 | #179 | Average 9.1% |
| Immigrants | Uganda | 43.4 /100 | #180 | Average 9.1% |
| Hmong | 40.2 /100 | #181 | Average 9.1% |
| Immigrants | Morocco | 40.2 /100 | #182 | Average 9.1% |
| Uruguayans | 39.2 /100 | #183 | Fair 9.1% |
| South American Indians | 38.7 /100 | #184 | Fair 9.1% |
| Immigrants | Saudi Arabia | 38.6 /100 | #185 | Fair 9.1% |
| Colombians | 36.1 /100 | #186 | Fair 9.2% |
| Delaware | 35.4 /100 | #187 | Fair 9.2% |
| Immigrants | Kenya | 34.0 /100 | #188 | Fair 9.2% |
| Immigrants | Afghanistan | 32.1 /100 | #189 | Fair 9.2% |
| Arabs | 31.5 /100 | #190 | Fair 9.2% |
| Ugandans | 28.7 /100 | #191 | Fair 9.3% |
| Spanish | 28.7 /100 | #192 | Fair 9.3% |