Immigrants from Belize vs Immigrants from Iraq Disability Age Over 75
COMPARE
Immigrants from Belize
Immigrants from Iraq
Disability Age Over 75
Disability Age Over 75 Comparison
Immigrants from Belize
Immigrants from Iraq
49.6%
DISABILITY AGE OVER 75
0.0/ 100
METRIC RATING
286th/ 347
METRIC RANK
49.1%
DISABILITY AGE OVER 75
0.1/ 100
METRIC RATING
273rd/ 347
METRIC RANK
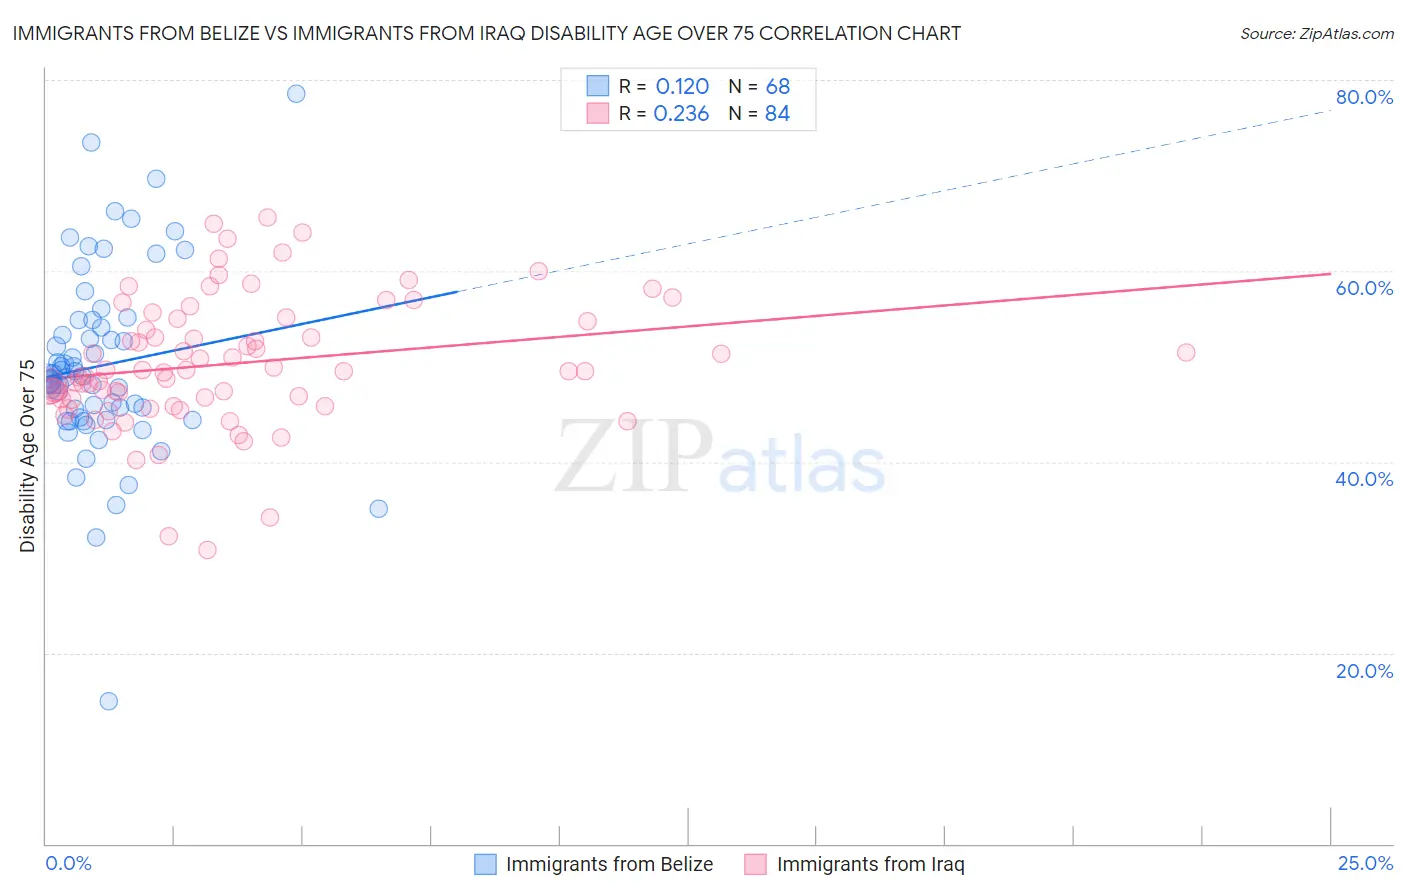
Immigrants from Belize vs Immigrants from Iraq Disability Age Over 75 Correlation Chart
The statistical analysis conducted on geographies consisting of 130,240,779 people shows a poor positive correlation between the proportion of Immigrants from Belize and percentage of population with a disability over the age of 75 in the United States with a correlation coefficient (R) of 0.120 and weighted average of 49.6%. Similarly, the statistical analysis conducted on geographies consisting of 194,692,045 people shows a weak positive correlation between the proportion of Immigrants from Iraq and percentage of population with a disability over the age of 75 in the United States with a correlation coefficient (R) of 0.236 and weighted average of 49.1%, a difference of 1.1%.
Disability Age Over 75 Correlation Summary
| Measurement | Immigrants from Belize | Immigrants from Iraq |
| Minimum | 14.9% | 30.8% |
| Maximum | 78.6% | 65.6% |
| Range | 63.7% | 34.8% |
| Mean | 50.1% | 50.3% |
| Median | 48.8% | 49.5% |
| Interquartile 25% (IQ1) | 44.5% | 46.6% |
| Interquartile 75% (IQ3) | 54.5% | 54.9% |
| Interquartile Range (IQR) | 10.0% | 8.3% |
| Standard Deviation (Sample) | 9.9% | 6.8% |
| Standard Deviation (Population) | 9.8% | 6.7% |
Demographics Similar to Immigrants from Belize and Immigrants from Iraq by Disability Age Over 75
In terms of disability age over 75, the demographic groups most similar to Immigrants from Belize are Crow (49.6%, a difference of 0.080%), Sioux (49.7%, a difference of 0.21%), Immigrants from Latin America (49.5%, a difference of 0.22%), Yaqui (49.8%, a difference of 0.26%), and Samoan (49.5%, a difference of 0.27%). Similarly, the demographic groups most similar to Immigrants from Iraq are Assyrian/Chaldean/Syriac (49.1%, a difference of 0.050%), Fijian (49.0%, a difference of 0.060%), Immigrants from Guatemala (49.1%, a difference of 0.070%), Immigrants from Dominica (49.1%, a difference of 0.080%), and Potawatomi (49.0%, a difference of 0.090%).
| Demographics | Rating | Rank | Disability Age Over 75 |
| Immigrants | El Salvador | 0.2 /100 | #269 | Tragic 49.0% |
| Potawatomi | 0.2 /100 | #270 | Tragic 49.0% |
| Fijians | 0.2 /100 | #271 | Tragic 49.0% |
| Assyrians/Chaldeans/Syriacs | 0.2 /100 | #272 | Tragic 49.1% |
| Immigrants | Iraq | 0.1 /100 | #273 | Tragic 49.1% |
| Immigrants | Guatemala | 0.1 /100 | #274 | Tragic 49.1% |
| Immigrants | Dominica | 0.1 /100 | #275 | Tragic 49.1% |
| Immigrants | Uzbekistan | 0.1 /100 | #276 | Tragic 49.2% |
| Hawaiians | 0.1 /100 | #277 | Tragic 49.2% |
| Immigrants | Laos | 0.1 /100 | #278 | Tragic 49.2% |
| Guamanians/Chamorros | 0.0 /100 | #279 | Tragic 49.4% |
| Bangladeshis | 0.0 /100 | #280 | Tragic 49.4% |
| Belizeans | 0.0 /100 | #281 | Tragic 49.4% |
| Blacks/African Americans | 0.0 /100 | #282 | Tragic 49.5% |
| Samoans | 0.0 /100 | #283 | Tragic 49.5% |
| Immigrants | Latin America | 0.0 /100 | #284 | Tragic 49.5% |
| Crow | 0.0 /100 | #285 | Tragic 49.6% |
| Immigrants | Belize | 0.0 /100 | #286 | Tragic 49.6% |
| Sioux | 0.0 /100 | #287 | Tragic 49.7% |
| Yaqui | 0.0 /100 | #288 | Tragic 49.8% |
| Osage | 0.0 /100 | #289 | Tragic 49.8% |