Immigrants from Belgium vs South American Nursery School
COMPARE
Immigrants from Belgium
South American
Nursery School
Nursery School Comparison
Immigrants from Belgium
South Americans
98.3%
NURSERY SCHOOL
99.3/ 100
METRIC RATING
79th/ 347
METRIC RANK
97.6%
NURSERY SCHOOL
1.0/ 100
METRIC RATING
244th/ 347
METRIC RANK
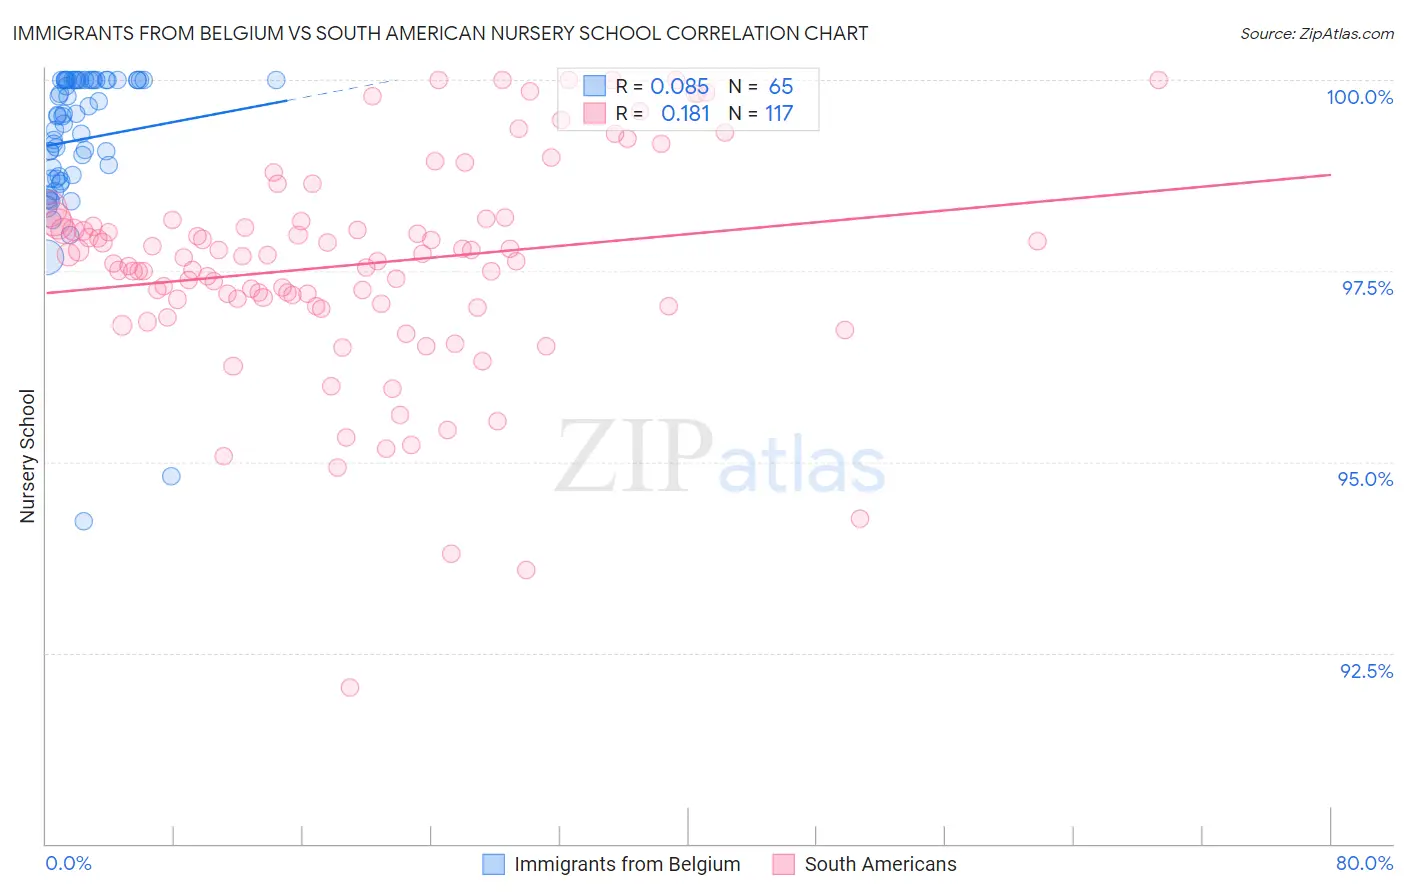
Immigrants from Belgium vs South American Nursery School Correlation Chart
The statistical analysis conducted on geographies consisting of 146,727,969 people shows a slight positive correlation between the proportion of Immigrants from Belgium and percentage of population with at least nursery school education in the United States with a correlation coefficient (R) of 0.085 and weighted average of 98.3%. Similarly, the statistical analysis conducted on geographies consisting of 494,178,447 people shows a poor positive correlation between the proportion of South Americans and percentage of population with at least nursery school education in the United States with a correlation coefficient (R) of 0.181 and weighted average of 97.6%, a difference of 0.71%.
Nursery School Correlation Summary
| Measurement | Immigrants from Belgium | South American |
| Minimum | 94.2% | 92.1% |
| Maximum | 100.0% | 100.0% |
| Range | 5.8% | 7.9% |
| Mean | 99.2% | 97.6% |
| Median | 99.5% | 97.7% |
| Interquartile 25% (IQ1) | 98.7% | 97.1% |
| Interquartile 75% (IQ3) | 100.0% | 98.2% |
| Interquartile Range (IQR) | 1.3% | 1.1% |
| Standard Deviation (Sample) | 1.1% | 1.4% |
| Standard Deviation (Population) | 1.1% | 1.4% |
Similar Demographics by Nursery School
Demographics Similar to Immigrants from Belgium by Nursery School
In terms of nursery school, the demographic groups most similar to Immigrants from Belgium are Cherokee (98.3%, a difference of 0.0%), Immigrants from England (98.3%, a difference of 0.0%), Immigrants from Lithuania (98.3%, a difference of 0.0%), Delaware (98.3%, a difference of 0.0%), and Shoshone (98.3%, a difference of 0.0%).
| Demographics | Rating | Rank | Nursery School |
| Chickasaw | 99.6 /100 | #72 | Exceptional 98.4% |
| Cajuns | 99.4 /100 | #73 | Exceptional 98.4% |
| Immigrants | Netherlands | 99.4 /100 | #74 | Exceptional 98.4% |
| Cherokee | 99.3 /100 | #75 | Exceptional 98.3% |
| Immigrants | England | 99.3 /100 | #76 | Exceptional 98.3% |
| Immigrants | Lithuania | 99.3 /100 | #77 | Exceptional 98.3% |
| Delaware | 99.3 /100 | #78 | Exceptional 98.3% |
| Immigrants | Belgium | 99.3 /100 | #79 | Exceptional 98.3% |
| Shoshone | 99.3 /100 | #80 | Exceptional 98.3% |
| Icelanders | 99.2 /100 | #81 | Exceptional 98.3% |
| Potawatomi | 99.2 /100 | #82 | Exceptional 98.3% |
| Osage | 99.1 /100 | #83 | Exceptional 98.3% |
| Immigrants | Denmark | 99.1 /100 | #84 | Exceptional 98.3% |
| Immigrants | Sweden | 99.1 /100 | #85 | Exceptional 98.3% |
| Immigrants | Australia | 99.0 /100 | #86 | Exceptional 98.3% |
Demographics Similar to South Americans by Nursery School
In terms of nursery school, the demographic groups most similar to South Americans are Asian (97.6%, a difference of 0.0%), Bolivian (97.6%, a difference of 0.0%), Peruvian (97.6%, a difference of 0.0%), Immigrants from Indonesia (97.7%, a difference of 0.010%), and Liberian (97.7%, a difference of 0.010%).
| Demographics | Rating | Rank | Nursery School |
| Immigrants | Western Asia | 1.9 /100 | #237 | Tragic 97.7% |
| Nigerians | 1.7 /100 | #238 | Tragic 97.7% |
| Immigrants | Eastern Asia | 1.6 /100 | #239 | Tragic 97.7% |
| Koreans | 1.4 /100 | #240 | Tragic 97.7% |
| Immigrants | Indonesia | 1.1 /100 | #241 | Tragic 97.7% |
| Liberians | 1.1 /100 | #242 | Tragic 97.7% |
| Asians | 1.1 /100 | #243 | Tragic 97.6% |
| South Americans | 1.0 /100 | #244 | Tragic 97.6% |
| Bolivians | 1.0 /100 | #245 | Tragic 97.6% |
| Peruvians | 1.0 /100 | #246 | Tragic 97.6% |
| Immigrants | Middle Africa | 0.9 /100 | #247 | Tragic 97.6% |
| Indians (Asian) | 0.9 /100 | #248 | Tragic 97.6% |
| Immigrants | Eastern Africa | 0.9 /100 | #249 | Tragic 97.6% |
| Immigrants | Senegal | 0.9 /100 | #250 | Tragic 97.6% |
| Ethiopians | 0.8 /100 | #251 | Tragic 97.6% |