Immigrants from Switzerland vs Immigrants from Western Europe Single Mother Poverty
COMPARE
Immigrants from Switzerland
Immigrants from Western Europe
Single Mother Poverty
Single Mother Poverty Comparison
Immigrants from Switzerland
Immigrants from Western Europe
28.3%
SINGLE MOTHER POVERTY
91.7/ 100
METRIC RATING
124th/ 347
METRIC RANK
28.9%
SINGLE MOTHER POVERTY
71.1/ 100
METRIC RATING
157th/ 347
METRIC RANK
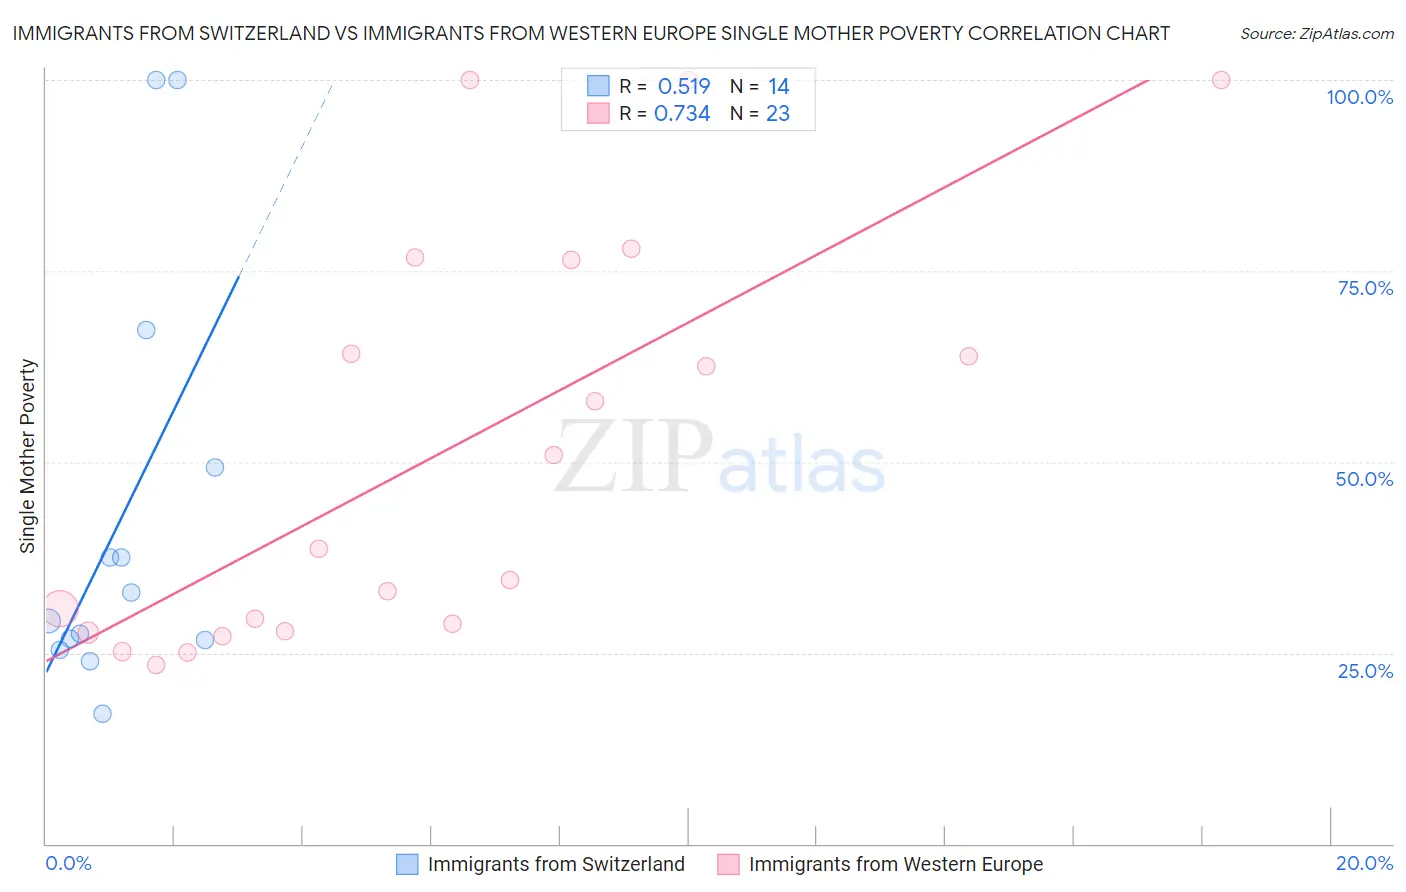
Immigrants from Switzerland vs Immigrants from Western Europe Single Mother Poverty Correlation Chart
The statistical analysis conducted on geographies consisting of 145,488,343 people shows a substantial positive correlation between the proportion of Immigrants from Switzerland and poverty level among single mothers in the United States with a correlation coefficient (R) of 0.519 and weighted average of 28.3%. Similarly, the statistical analysis conducted on geographies consisting of 476,604,717 people shows a strong positive correlation between the proportion of Immigrants from Western Europe and poverty level among single mothers in the United States with a correlation coefficient (R) of 0.734 and weighted average of 28.9%, a difference of 1.8%.
Single Mother Poverty Correlation Summary
| Measurement | Immigrants from Switzerland | Immigrants from Western Europe |
| Minimum | 17.0% | 23.4% |
| Maximum | 100.0% | 100.0% |
| Range | 83.0% | 76.6% |
| Mean | 42.9% | 51.4% |
| Median | 31.0% | 38.6% |
| Interquartile 25% (IQ1) | 26.7% | 27.9% |
| Interquartile 75% (IQ3) | 49.2% | 76.4% |
| Interquartile Range (IQR) | 22.5% | 48.5% |
| Standard Deviation (Sample) | 27.2% | 26.6% |
| Standard Deviation (Population) | 26.2% | 26.1% |
Similar Demographics by Single Mother Poverty
Demographics Similar to Immigrants from Switzerland by Single Mother Poverty
In terms of single mother poverty, the demographic groups most similar to Immigrants from Switzerland are Uruguayan (28.3%, a difference of 0.0%), Colombian (28.3%, a difference of 0.010%), Immigrants from Afghanistan (28.3%, a difference of 0.060%), Cypriot (28.3%, a difference of 0.10%), and Immigrants from Syria (28.3%, a difference of 0.12%).
| Demographics | Rating | Rank | Single Mother Poverty |
| Australians | 92.5 /100 | #117 | Exceptional 28.3% |
| Brazilians | 92.4 /100 | #118 | Exceptional 28.3% |
| Immigrants | Syria | 92.4 /100 | #119 | Exceptional 28.3% |
| Cypriots | 92.3 /100 | #120 | Exceptional 28.3% |
| Immigrants | Afghanistan | 92.1 /100 | #121 | Exceptional 28.3% |
| Colombians | 91.8 /100 | #122 | Exceptional 28.3% |
| Uruguayans | 91.7 /100 | #123 | Exceptional 28.3% |
| Immigrants | Switzerland | 91.7 /100 | #124 | Exceptional 28.3% |
| Kenyans | 90.9 /100 | #125 | Exceptional 28.4% |
| Immigrants | Chile | 90.8 /100 | #126 | Exceptional 28.4% |
| Poles | 90.8 /100 | #127 | Exceptional 28.4% |
| Immigrants | England | 90.5 /100 | #128 | Exceptional 28.4% |
| South Americans | 90.4 /100 | #129 | Exceptional 28.4% |
| Norwegians | 90.4 /100 | #130 | Exceptional 28.4% |
| Immigrants | Austria | 90.3 /100 | #131 | Exceptional 28.4% |
Demographics Similar to Immigrants from Western Europe by Single Mother Poverty
In terms of single mother poverty, the demographic groups most similar to Immigrants from Western Europe are Iraqi (28.8%, a difference of 0.030%), Immigrants from Hungary (28.9%, a difference of 0.030%), Ugandan (28.8%, a difference of 0.040%), Portuguese (28.8%, a difference of 0.13%), and Czech (28.9%, a difference of 0.15%).
| Demographics | Rating | Rank | Single Mother Poverty |
| Northern Europeans | 81.7 /100 | #150 | Excellent 28.6% |
| Immigrants | Oceania | 79.9 /100 | #151 | Good 28.7% |
| Austrians | 79.0 /100 | #152 | Good 28.7% |
| Slovenes | 76.4 /100 | #153 | Good 28.8% |
| Portuguese | 73.2 /100 | #154 | Good 28.8% |
| Ugandans | 71.7 /100 | #155 | Good 28.8% |
| Iraqis | 71.5 /100 | #156 | Good 28.8% |
| Immigrants | Western Europe | 71.1 /100 | #157 | Good 28.9% |
| Immigrants | Hungary | 70.6 /100 | #158 | Good 28.9% |
| Czechs | 68.4 /100 | #159 | Good 28.9% |
| Japanese | 68.0 /100 | #160 | Good 28.9% |
| Immigrants | Cambodia | 66.6 /100 | #161 | Good 28.9% |
| Scandinavians | 66.2 /100 | #162 | Good 28.9% |
| Immigrants | Nigeria | 65.9 /100 | #163 | Good 28.9% |
| Immigrants | Kenya | 65.9 /100 | #164 | Good 28.9% |