Immigrants from Belarus vs Immigrants from Greece Seniors Poverty Over the Age of 75
COMPARE
Immigrants from Belarus
Immigrants from Greece
Seniors Poverty Over the Age of 75
Seniors Poverty Over the Age of 75 Comparison
Immigrants from Belarus
Immigrants from Greece
13.8%
SENIORS POVERTY OVER THE AGE OF 75
0.2/ 100
METRIC RATING
255th/ 347
METRIC RANK
12.1%
SENIORS POVERTY OVER THE AGE OF 75
58.2/ 100
METRIC RATING
163rd/ 347
METRIC RANK
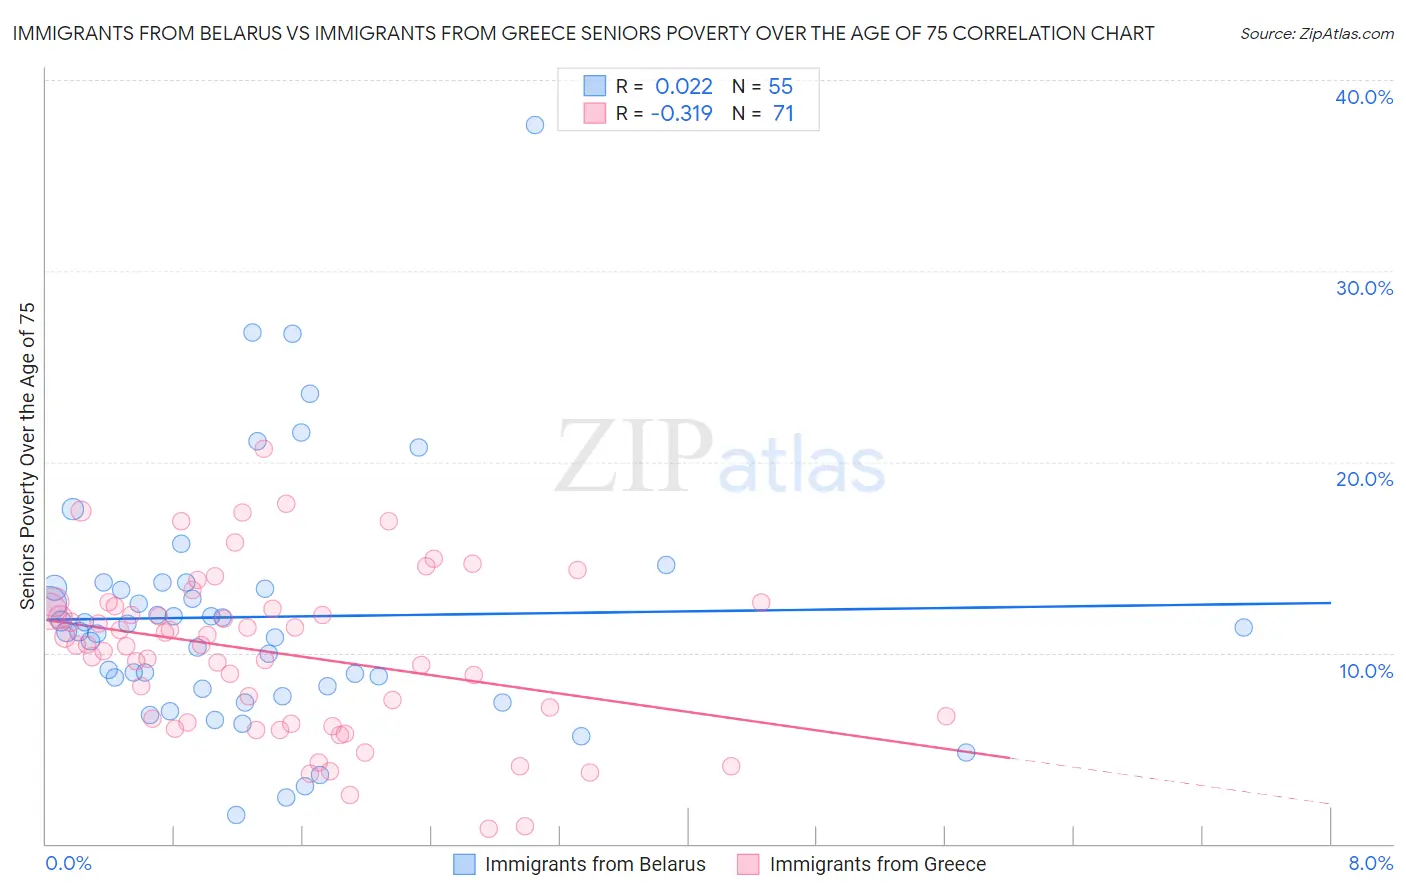
Immigrants from Belarus vs Immigrants from Greece Seniors Poverty Over the Age of 75 Correlation Chart
The statistical analysis conducted on geographies consisting of 149,396,429 people shows no correlation between the proportion of Immigrants from Belarus and poverty level among seniors over the age of 75 in the United States with a correlation coefficient (R) of 0.022 and weighted average of 13.8%. Similarly, the statistical analysis conducted on geographies consisting of 215,709,798 people shows a mild negative correlation between the proportion of Immigrants from Greece and poverty level among seniors over the age of 75 in the United States with a correlation coefficient (R) of -0.319 and weighted average of 12.1%, a difference of 13.7%.
Seniors Poverty Over the Age of 75 Correlation Summary
| Measurement | Immigrants from Belarus | Immigrants from Greece |
| Minimum | 1.5% | 0.75% |
| Maximum | 37.7% | 20.7% |
| Range | 36.2% | 19.9% |
| Mean | 11.9% | 10.0% |
| Median | 11.1% | 10.4% |
| Interquartile 25% (IQ1) | 8.1% | 6.3% |
| Interquartile 75% (IQ3) | 13.4% | 12.5% |
| Interquartile Range (IQR) | 5.3% | 6.1% |
| Standard Deviation (Sample) | 6.5% | 4.2% |
| Standard Deviation (Population) | 6.4% | 4.2% |
Similar Demographics by Seniors Poverty Over the Age of 75
Demographics Similar to Immigrants from Belarus by Seniors Poverty Over the Age of 75
In terms of seniors poverty over the age of 75, the demographic groups most similar to Immigrants from Belarus are Blackfeet (13.7%, a difference of 0.43%), Inupiat (13.8%, a difference of 0.50%), Immigrants from Spain (13.7%, a difference of 0.54%), Immigrants from Argentina (13.7%, a difference of 0.76%), and Immigrants from Peru (13.7%, a difference of 0.81%).
| Demographics | Rating | Rank | Seniors Poverty Over the Age of 75 |
| Africans | 0.3 /100 | #248 | Tragic 13.6% |
| Immigrants | Albania | 0.3 /100 | #249 | Tragic 13.6% |
| Mexican American Indians | 0.3 /100 | #250 | Tragic 13.6% |
| Immigrants | Peru | 0.3 /100 | #251 | Tragic 13.7% |
| Immigrants | Argentina | 0.3 /100 | #252 | Tragic 13.7% |
| Immigrants | Spain | 0.2 /100 | #253 | Tragic 13.7% |
| Blackfeet | 0.2 /100 | #254 | Tragic 13.7% |
| Immigrants | Belarus | 0.2 /100 | #255 | Tragic 13.8% |
| Inupiat | 0.1 /100 | #256 | Tragic 13.8% |
| Immigrants | Western Africa | 0.1 /100 | #257 | Tragic 13.9% |
| Immigrants | Panama | 0.1 /100 | #258 | Tragic 13.9% |
| Immigrants | Portugal | 0.1 /100 | #259 | Tragic 13.9% |
| Immigrants | Immigrants | 0.1 /100 | #260 | Tragic 13.9% |
| Ghanaians | 0.1 /100 | #261 | Tragic 14.0% |
| Cajuns | 0.1 /100 | #262 | Tragic 14.0% |
Demographics Similar to Immigrants from Greece by Seniors Poverty Over the Age of 75
In terms of seniors poverty over the age of 75, the demographic groups most similar to Immigrants from Greece are Potawatomi (12.1%, a difference of 0.070%), Okinawan (12.1%, a difference of 0.16%), Immigrants from Serbia (12.1%, a difference of 0.17%), Immigrants from Norway (12.1%, a difference of 0.21%), and Immigrants from Eastern Africa (12.1%, a difference of 0.23%).
| Demographics | Rating | Rank | Seniors Poverty Over the Age of 75 |
| Immigrants | Burma/Myanmar | 62.3 /100 | #156 | Good 12.1% |
| Immigrants | Sudan | 61.7 /100 | #157 | Good 12.1% |
| Portuguese | 61.3 /100 | #158 | Good 12.1% |
| Immigrants | Middle Africa | 61.2 /100 | #159 | Good 12.1% |
| Immigrants | Eastern Africa | 60.9 /100 | #160 | Good 12.1% |
| Immigrants | Norway | 60.6 /100 | #161 | Good 12.1% |
| Immigrants | Serbia | 60.2 /100 | #162 | Good 12.1% |
| Immigrants | Greece | 58.2 /100 | #163 | Average 12.1% |
| Potawatomi | 57.4 /100 | #164 | Average 12.1% |
| Okinawans | 56.3 /100 | #165 | Average 12.1% |
| Egyptians | 54.8 /100 | #166 | Average 12.1% |
| Immigrants | Switzerland | 54.5 /100 | #167 | Average 12.1% |
| Immigrants | Syria | 53.9 /100 | #168 | Average 12.2% |
| Immigrants | Egypt | 53.7 /100 | #169 | Average 12.2% |
| Immigrants | Thailand | 52.0 /100 | #170 | Average 12.2% |