Immigrants from Belarus vs French Canadian Seniors Poverty Over the Age of 75
COMPARE
Immigrants from Belarus
French Canadian
Seniors Poverty Over the Age of 75
Seniors Poverty Over the Age of 75 Comparison
Immigrants from Belarus
French Canadians
13.8%
SENIORS POVERTY OVER THE AGE OF 75
0.2/ 100
METRIC RATING
255th/ 347
METRIC RANK
11.4%
SENIORS POVERTY OVER THE AGE OF 75
95.7/ 100
METRIC RATING
76th/ 347
METRIC RANK
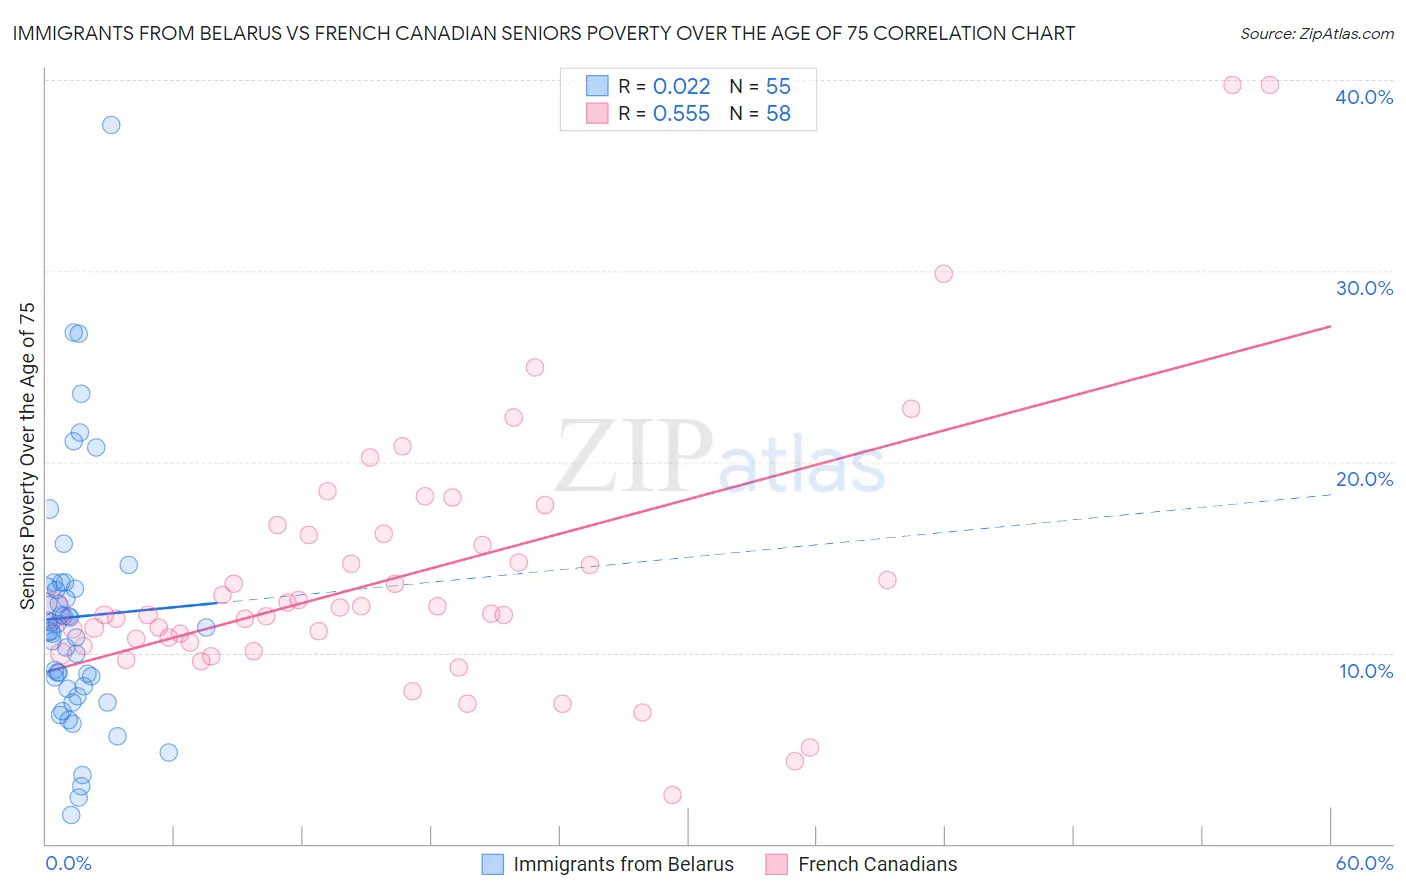
Immigrants from Belarus vs French Canadian Seniors Poverty Over the Age of 75 Correlation Chart
The statistical analysis conducted on geographies consisting of 149,396,429 people shows no correlation between the proportion of Immigrants from Belarus and poverty level among seniors over the age of 75 in the United States with a correlation coefficient (R) of 0.022 and weighted average of 13.8%. Similarly, the statistical analysis conducted on geographies consisting of 492,347,297 people shows a substantial positive correlation between the proportion of French Canadians and poverty level among seniors over the age of 75 in the United States with a correlation coefficient (R) of 0.555 and weighted average of 11.4%, a difference of 20.5%.
Seniors Poverty Over the Age of 75 Correlation Summary
| Measurement | Immigrants from Belarus | French Canadian |
| Minimum | 1.5% | 2.6% |
| Maximum | 37.7% | 39.7% |
| Range | 36.2% | 37.2% |
| Mean | 11.9% | 14.0% |
| Median | 11.1% | 12.1% |
| Interquartile 25% (IQ1) | 8.1% | 10.6% |
| Interquartile 75% (IQ3) | 13.4% | 16.1% |
| Interquartile Range (IQR) | 5.3% | 5.6% |
| Standard Deviation (Sample) | 6.5% | 6.9% |
| Standard Deviation (Population) | 6.4% | 6.9% |
Similar Demographics by Seniors Poverty Over the Age of 75
Demographics Similar to Immigrants from Belarus by Seniors Poverty Over the Age of 75
In terms of seniors poverty over the age of 75, the demographic groups most similar to Immigrants from Belarus are Blackfeet (13.7%, a difference of 0.43%), Inupiat (13.8%, a difference of 0.50%), Immigrants from Spain (13.7%, a difference of 0.54%), Immigrants from Argentina (13.7%, a difference of 0.76%), and Immigrants from Peru (13.7%, a difference of 0.81%).
| Demographics | Rating | Rank | Seniors Poverty Over the Age of 75 |
| Africans | 0.3 /100 | #248 | Tragic 13.6% |
| Immigrants | Albania | 0.3 /100 | #249 | Tragic 13.6% |
| Mexican American Indians | 0.3 /100 | #250 | Tragic 13.6% |
| Immigrants | Peru | 0.3 /100 | #251 | Tragic 13.7% |
| Immigrants | Argentina | 0.3 /100 | #252 | Tragic 13.7% |
| Immigrants | Spain | 0.2 /100 | #253 | Tragic 13.7% |
| Blackfeet | 0.2 /100 | #254 | Tragic 13.7% |
| Immigrants | Belarus | 0.2 /100 | #255 | Tragic 13.8% |
| Inupiat | 0.1 /100 | #256 | Tragic 13.8% |
| Immigrants | Western Africa | 0.1 /100 | #257 | Tragic 13.9% |
| Immigrants | Panama | 0.1 /100 | #258 | Tragic 13.9% |
| Immigrants | Portugal | 0.1 /100 | #259 | Tragic 13.9% |
| Immigrants | Immigrants | 0.1 /100 | #260 | Tragic 13.9% |
| Ghanaians | 0.1 /100 | #261 | Tragic 14.0% |
| Cajuns | 0.1 /100 | #262 | Tragic 14.0% |
Demographics Similar to French Canadians by Seniors Poverty Over the Age of 75
In terms of seniors poverty over the age of 75, the demographic groups most similar to French Canadians are Palestinian (11.4%, a difference of 0.070%), White/Caucasian (11.4%, a difference of 0.080%), Macedonian (11.4%, a difference of 0.090%), Filipino (11.4%, a difference of 0.10%), and Alaska Native (11.4%, a difference of 0.15%).
| Demographics | Rating | Rank | Seniors Poverty Over the Age of 75 |
| Ottawa | 96.5 /100 | #69 | Exceptional 11.4% |
| Immigrants | South Central Asia | 96.4 /100 | #70 | Exceptional 11.4% |
| Osage | 96.3 /100 | #71 | Exceptional 11.4% |
| Sierra Leoneans | 96.1 /100 | #72 | Exceptional 11.4% |
| Immigrants | Micronesia | 96.0 /100 | #73 | Exceptional 11.4% |
| Delaware | 96.0 /100 | #74 | Exceptional 11.4% |
| Palestinians | 95.8 /100 | #75 | Exceptional 11.4% |
| French Canadians | 95.7 /100 | #76 | Exceptional 11.4% |
| Whites/Caucasians | 95.5 /100 | #77 | Exceptional 11.4% |
| Macedonians | 95.5 /100 | #78 | Exceptional 11.4% |
| Filipinos | 95.5 /100 | #79 | Exceptional 11.4% |
| Alaska Natives | 95.4 /100 | #80 | Exceptional 11.4% |
| Basques | 95.1 /100 | #81 | Exceptional 11.5% |
| Iranians | 95.1 /100 | #82 | Exceptional 11.5% |
| Immigrants | South Africa | 94.9 /100 | #83 | Exceptional 11.5% |