Immigrants from Uzbekistan vs Immigrants from Greece Seniors Poverty Over the Age of 75
COMPARE
Immigrants from Uzbekistan
Immigrants from Greece
Seniors Poverty Over the Age of 75
Seniors Poverty Over the Age of 75 Comparison
Immigrants from Uzbekistan
Immigrants from Greece
16.5%
SENIORS POVERTY OVER THE AGE OF 75
0.0/ 100
METRIC RATING
324th/ 347
METRIC RANK
12.1%
SENIORS POVERTY OVER THE AGE OF 75
58.2/ 100
METRIC RATING
163rd/ 347
METRIC RANK
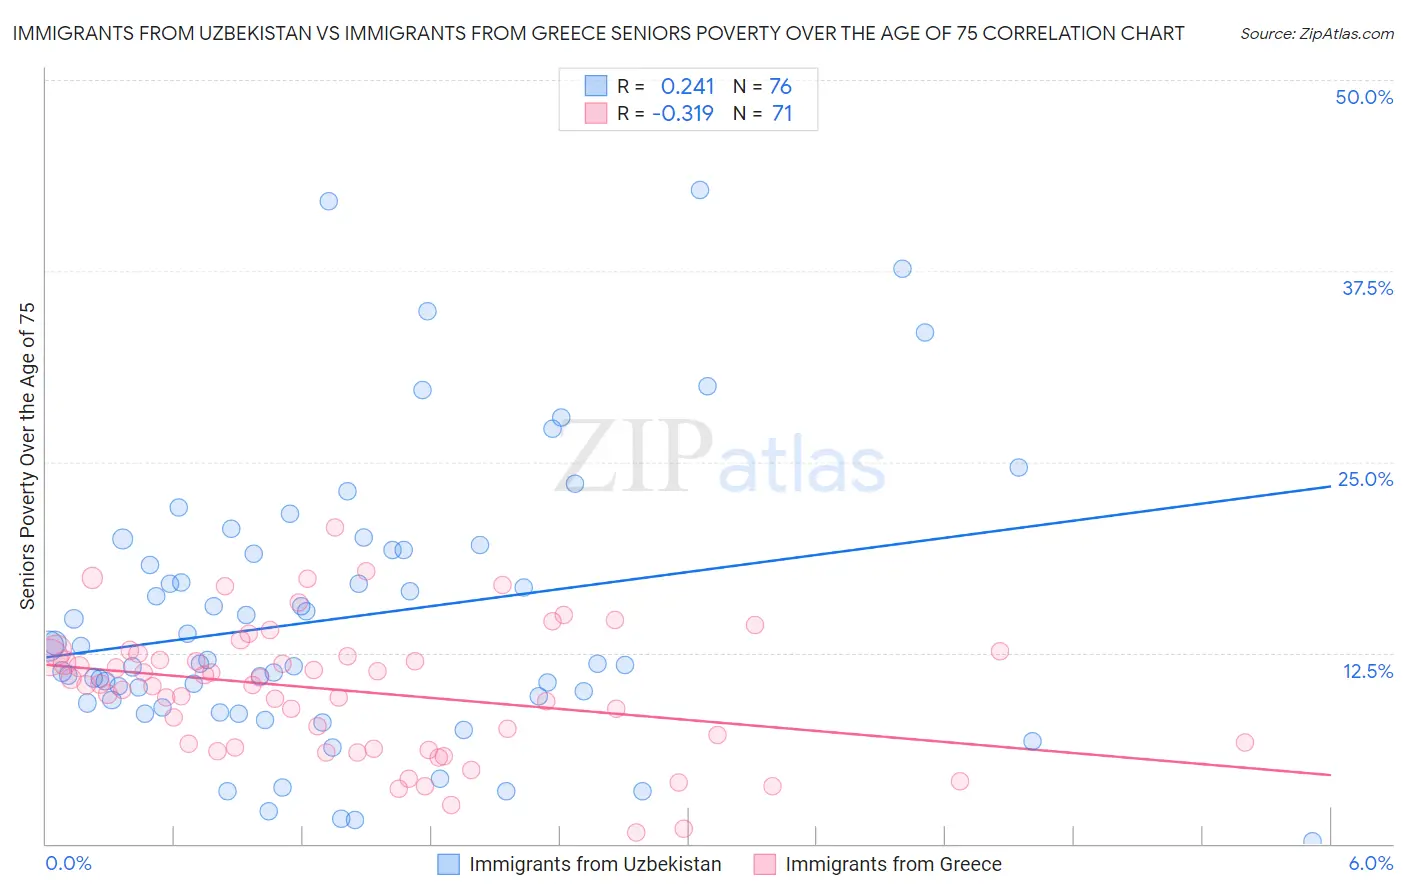
Immigrants from Uzbekistan vs Immigrants from Greece Seniors Poverty Over the Age of 75 Correlation Chart
The statistical analysis conducted on geographies consisting of 118,161,446 people shows a weak positive correlation between the proportion of Immigrants from Uzbekistan and poverty level among seniors over the age of 75 in the United States with a correlation coefficient (R) of 0.241 and weighted average of 16.5%. Similarly, the statistical analysis conducted on geographies consisting of 215,709,798 people shows a mild negative correlation between the proportion of Immigrants from Greece and poverty level among seniors over the age of 75 in the United States with a correlation coefficient (R) of -0.319 and weighted average of 12.1%, a difference of 36.7%.
Seniors Poverty Over the Age of 75 Correlation Summary
| Measurement | Immigrants from Uzbekistan | Immigrants from Greece |
| Minimum | 0.17% | 0.75% |
| Maximum | 42.8% | 20.7% |
| Range | 42.6% | 19.9% |
| Mean | 14.8% | 10.0% |
| Median | 11.9% | 10.4% |
| Interquartile 25% (IQ1) | 9.3% | 6.3% |
| Interquartile 75% (IQ3) | 19.2% | 12.5% |
| Interquartile Range (IQR) | 9.9% | 6.1% |
| Standard Deviation (Sample) | 9.1% | 4.2% |
| Standard Deviation (Population) | 9.1% | 4.2% |
Similar Demographics by Seniors Poverty Over the Age of 75
Demographics Similar to Immigrants from Uzbekistan by Seniors Poverty Over the Age of 75
In terms of seniors poverty over the age of 75, the demographic groups most similar to Immigrants from Uzbekistan are Central American Indian (16.5%, a difference of 0.050%), Immigrants from Barbados (16.5%, a difference of 0.14%), Immigrants from Haiti (16.5%, a difference of 0.16%), Immigrants from Yemen (16.5%, a difference of 0.35%), and Nicaraguan (16.6%, a difference of 0.38%).
| Demographics | Rating | Rank | Seniors Poverty Over the Age of 75 |
| Immigrants | Guyana | 0.0 /100 | #317 | Tragic 16.2% |
| Houma | 0.0 /100 | #318 | Tragic 16.2% |
| Haitians | 0.0 /100 | #319 | Tragic 16.2% |
| Immigrants | Yemen | 0.0 /100 | #320 | Tragic 16.5% |
| Immigrants | Haiti | 0.0 /100 | #321 | Tragic 16.5% |
| Immigrants | Barbados | 0.0 /100 | #322 | Tragic 16.5% |
| Central American Indians | 0.0 /100 | #323 | Tragic 16.5% |
| Immigrants | Uzbekistan | 0.0 /100 | #324 | Tragic 16.5% |
| Nicaraguans | 0.0 /100 | #325 | Tragic 16.6% |
| Pueblo | 0.0 /100 | #326 | Tragic 16.7% |
| Sioux | 0.0 /100 | #327 | Tragic 16.8% |
| Cape Verdeans | 0.0 /100 | #328 | Tragic 16.8% |
| Immigrants | Dominica | 0.0 /100 | #329 | Tragic 17.0% |
| British West Indians | 0.0 /100 | #330 | Tragic 17.4% |
| Immigrants | Armenia | 0.0 /100 | #331 | Tragic 17.5% |
Demographics Similar to Immigrants from Greece by Seniors Poverty Over the Age of 75
In terms of seniors poverty over the age of 75, the demographic groups most similar to Immigrants from Greece are Potawatomi (12.1%, a difference of 0.070%), Okinawan (12.1%, a difference of 0.16%), Immigrants from Serbia (12.1%, a difference of 0.17%), Immigrants from Norway (12.1%, a difference of 0.21%), and Immigrants from Eastern Africa (12.1%, a difference of 0.23%).
| Demographics | Rating | Rank | Seniors Poverty Over the Age of 75 |
| Immigrants | Burma/Myanmar | 62.3 /100 | #156 | Good 12.1% |
| Immigrants | Sudan | 61.7 /100 | #157 | Good 12.1% |
| Portuguese | 61.3 /100 | #158 | Good 12.1% |
| Immigrants | Middle Africa | 61.2 /100 | #159 | Good 12.1% |
| Immigrants | Eastern Africa | 60.9 /100 | #160 | Good 12.1% |
| Immigrants | Norway | 60.6 /100 | #161 | Good 12.1% |
| Immigrants | Serbia | 60.2 /100 | #162 | Good 12.1% |
| Immigrants | Greece | 58.2 /100 | #163 | Average 12.1% |
| Potawatomi | 57.4 /100 | #164 | Average 12.1% |
| Okinawans | 56.3 /100 | #165 | Average 12.1% |
| Egyptians | 54.8 /100 | #166 | Average 12.1% |
| Immigrants | Switzerland | 54.5 /100 | #167 | Average 12.1% |
| Immigrants | Syria | 53.9 /100 | #168 | Average 12.2% |
| Immigrants | Egypt | 53.7 /100 | #169 | Average 12.2% |
| Immigrants | Thailand | 52.0 /100 | #170 | Average 12.2% |