Immigrants from Romania vs Immigrants from Greece Seniors Poverty Over the Age of 75
COMPARE
Immigrants from Romania
Immigrants from Greece
Seniors Poverty Over the Age of 75
Seniors Poverty Over the Age of 75 Comparison
Immigrants from Romania
Immigrants from Greece
11.9%
SENIORS POVERTY OVER THE AGE OF 75
72.6/ 100
METRIC RATING
138th/ 347
METRIC RANK
12.1%
SENIORS POVERTY OVER THE AGE OF 75
58.2/ 100
METRIC RATING
163rd/ 347
METRIC RANK
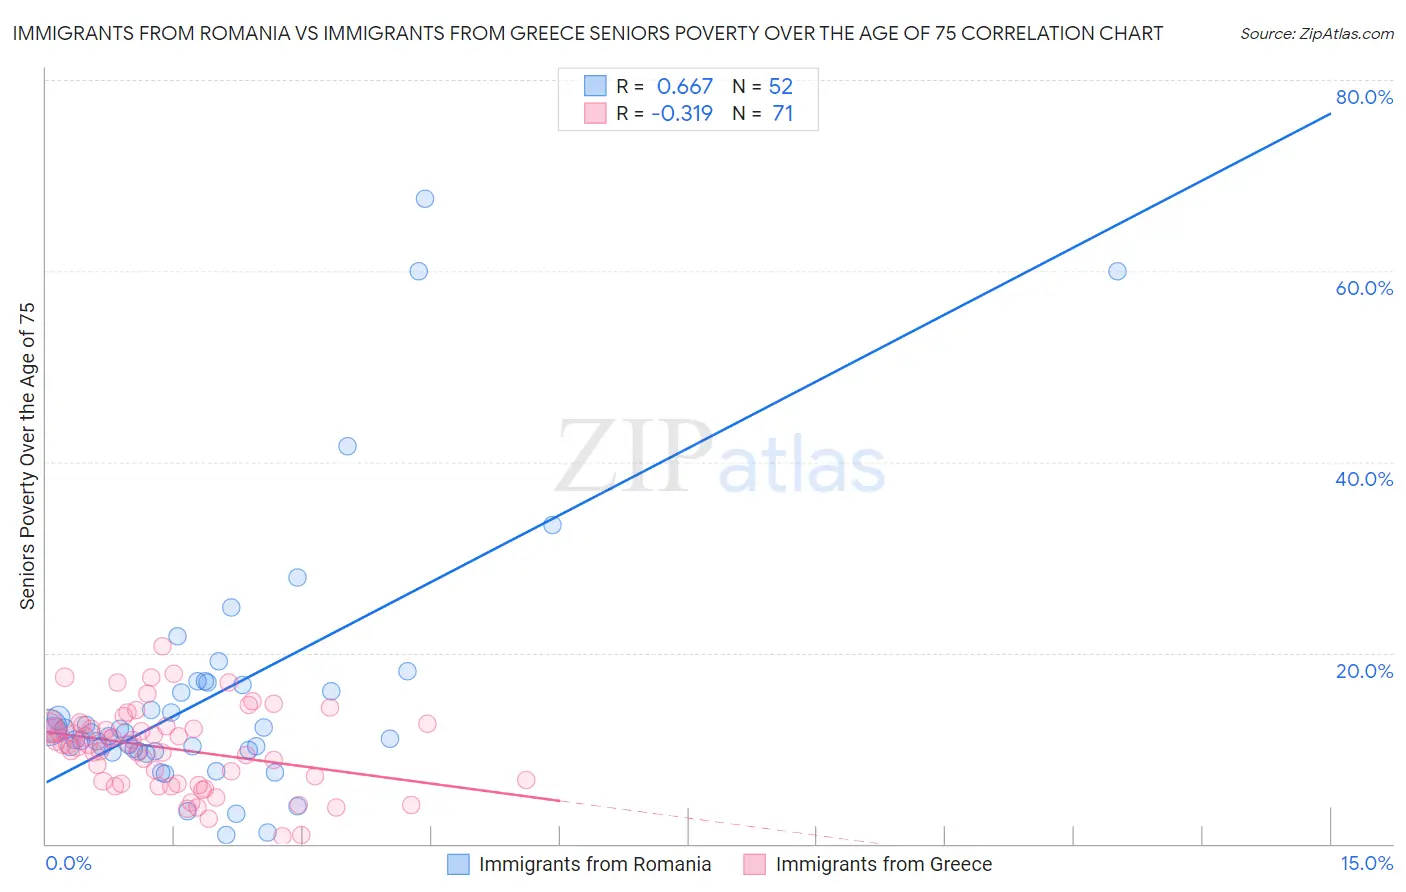
Immigrants from Romania vs Immigrants from Greece Seniors Poverty Over the Age of 75 Correlation Chart
The statistical analysis conducted on geographies consisting of 255,271,790 people shows a significant positive correlation between the proportion of Immigrants from Romania and poverty level among seniors over the age of 75 in the United States with a correlation coefficient (R) of 0.667 and weighted average of 11.9%. Similarly, the statistical analysis conducted on geographies consisting of 215,709,798 people shows a mild negative correlation between the proportion of Immigrants from Greece and poverty level among seniors over the age of 75 in the United States with a correlation coefficient (R) of -0.319 and weighted average of 12.1%, a difference of 1.3%.
Seniors Poverty Over the Age of 75 Correlation Summary
| Measurement | Immigrants from Romania | Immigrants from Greece |
| Minimum | 0.92% | 0.75% |
| Maximum | 67.5% | 20.7% |
| Range | 66.6% | 19.9% |
| Mean | 15.7% | 10.0% |
| Median | 11.7% | 10.4% |
| Interquartile 25% (IQ1) | 9.8% | 6.3% |
| Interquartile 75% (IQ3) | 16.8% | 12.5% |
| Interquartile Range (IQR) | 7.0% | 6.1% |
| Standard Deviation (Sample) | 13.7% | 4.2% |
| Standard Deviation (Population) | 13.6% | 4.2% |
Similar Demographics by Seniors Poverty Over the Age of 75
Demographics Similar to Immigrants from Romania by Seniors Poverty Over the Age of 75
In terms of seniors poverty over the age of 75, the demographic groups most similar to Immigrants from Romania are Immigrants from Kenya (11.9%, a difference of 0.010%), Immigrants from Pakistan (12.0%, a difference of 0.080%), Immigrants from Cameroon (12.0%, a difference of 0.090%), Immigrants from Laos (12.0%, a difference of 0.12%), and Immigrants from Moldova (11.9%, a difference of 0.16%).
| Demographics | Rating | Rank | Seniors Poverty Over the Age of 75 |
| Immigrants | Western Europe | 79.6 /100 | #131 | Good 11.9% |
| Lebanese | 78.3 /100 | #132 | Good 11.9% |
| Immigrants | Sierra Leone | 77.6 /100 | #133 | Good 11.9% |
| Ugandans | 77.1 /100 | #134 | Good 11.9% |
| Immigrants | Ireland | 76.2 /100 | #135 | Good 11.9% |
| Immigrants | Philippines | 75.0 /100 | #136 | Good 11.9% |
| Immigrants | Moldova | 74.1 /100 | #137 | Good 11.9% |
| Immigrants | Romania | 72.6 /100 | #138 | Good 11.9% |
| Immigrants | Kenya | 72.6 /100 | #139 | Good 11.9% |
| Immigrants | Pakistan | 71.9 /100 | #140 | Good 12.0% |
| Immigrants | Cameroon | 71.7 /100 | #141 | Good 12.0% |
| Immigrants | Laos | 71.5 /100 | #142 | Good 12.0% |
| Americans | 71.0 /100 | #143 | Good 12.0% |
| Hmong | 70.8 /100 | #144 | Good 12.0% |
| Immigrants | Belgium | 70.8 /100 | #145 | Good 12.0% |
Demographics Similar to Immigrants from Greece by Seniors Poverty Over the Age of 75
In terms of seniors poverty over the age of 75, the demographic groups most similar to Immigrants from Greece are Potawatomi (12.1%, a difference of 0.070%), Okinawan (12.1%, a difference of 0.16%), Immigrants from Serbia (12.1%, a difference of 0.17%), Immigrants from Norway (12.1%, a difference of 0.21%), and Immigrants from Eastern Africa (12.1%, a difference of 0.23%).
| Demographics | Rating | Rank | Seniors Poverty Over the Age of 75 |
| Immigrants | Burma/Myanmar | 62.3 /100 | #156 | Good 12.1% |
| Immigrants | Sudan | 61.7 /100 | #157 | Good 12.1% |
| Portuguese | 61.3 /100 | #158 | Good 12.1% |
| Immigrants | Middle Africa | 61.2 /100 | #159 | Good 12.1% |
| Immigrants | Eastern Africa | 60.9 /100 | #160 | Good 12.1% |
| Immigrants | Norway | 60.6 /100 | #161 | Good 12.1% |
| Immigrants | Serbia | 60.2 /100 | #162 | Good 12.1% |
| Immigrants | Greece | 58.2 /100 | #163 | Average 12.1% |
| Potawatomi | 57.4 /100 | #164 | Average 12.1% |
| Okinawans | 56.3 /100 | #165 | Average 12.1% |
| Egyptians | 54.8 /100 | #166 | Average 12.1% |
| Immigrants | Switzerland | 54.5 /100 | #167 | Average 12.1% |
| Immigrants | Syria | 53.9 /100 | #168 | Average 12.2% |
| Immigrants | Egypt | 53.7 /100 | #169 | Average 12.2% |
| Immigrants | Thailand | 52.0 /100 | #170 | Average 12.2% |