Immigrants from Belarus vs Immigrants from Greece Family Households with Children
COMPARE
Immigrants from Belarus
Immigrants from Greece
Family Households with Children
Family Households with Children Comparison
Immigrants from Belarus
Immigrants from Greece
26.8%
FAMILY HOUSEHOLDS WITH CHILDREN
1.1/ 100
METRIC RATING
261st/ 347
METRIC RANK
26.0%
FAMILY HOUSEHOLDS WITH CHILDREN
0.0/ 100
METRIC RATING
322nd/ 347
METRIC RANK
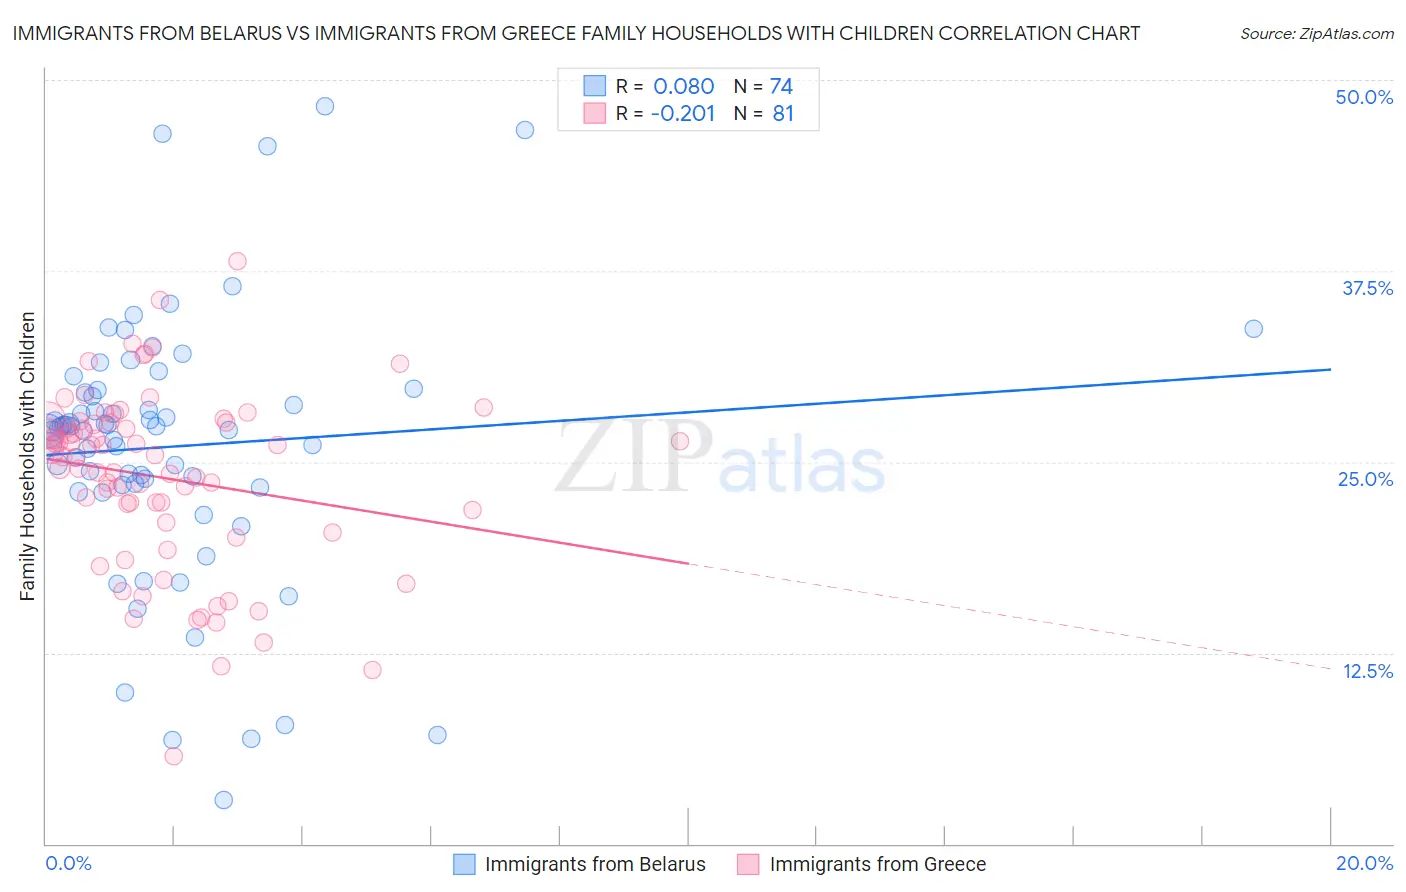
Immigrants from Belarus vs Immigrants from Greece Family Households with Children Correlation Chart
The statistical analysis conducted on geographies consisting of 150,186,430 people shows a slight positive correlation between the proportion of Immigrants from Belarus and percentage of family households with children in the United States with a correlation coefficient (R) of 0.080 and weighted average of 26.8%. Similarly, the statistical analysis conducted on geographies consisting of 216,757,437 people shows a weak negative correlation between the proportion of Immigrants from Greece and percentage of family households with children in the United States with a correlation coefficient (R) of -0.201 and weighted average of 26.0%, a difference of 2.9%.
Family Households with Children Correlation Summary
| Measurement | Immigrants from Belarus | Immigrants from Greece |
| Minimum | 2.8% | 5.8% |
| Maximum | 48.3% | 38.1% |
| Range | 45.4% | 32.4% |
| Mean | 26.0% | 24.0% |
| Median | 27.2% | 25.4% |
| Interquartile 25% (IQ1) | 23.5% | 20.7% |
| Interquartile 75% (IQ3) | 29.5% | 27.6% |
| Interquartile Range (IQR) | 6.0% | 6.9% |
| Standard Deviation (Sample) | 8.6% | 5.9% |
| Standard Deviation (Population) | 8.6% | 5.9% |
Similar Demographics by Family Households with Children
Demographics Similar to Immigrants from Belarus by Family Households with Children
In terms of family households with children, the demographic groups most similar to Immigrants from Belarus are Immigrants from Jamaica (26.8%, a difference of 0.060%), Immigrants from Russia (26.8%, a difference of 0.060%), Immigrants from North Macedonia (26.7%, a difference of 0.060%), Immigrants from Lithuania (26.8%, a difference of 0.070%), and Taiwanese (26.7%, a difference of 0.090%).
| Demographics | Rating | Rank | Family Households with Children |
| Immigrants | Scotland | 1.5 /100 | #254 | Tragic 26.8% |
| German Russians | 1.5 /100 | #255 | Tragic 26.8% |
| Scotch-Irish | 1.4 /100 | #256 | Tragic 26.8% |
| Slavs | 1.3 /100 | #257 | Tragic 26.8% |
| Immigrants | Cuba | 1.3 /100 | #258 | Tragic 26.8% |
| Immigrants | Lithuania | 1.2 /100 | #259 | Tragic 26.8% |
| Immigrants | Jamaica | 1.2 /100 | #260 | Tragic 26.8% |
| Immigrants | Belarus | 1.1 /100 | #261 | Tragic 26.8% |
| Immigrants | Russia | 1.0 /100 | #262 | Tragic 26.8% |
| Immigrants | North Macedonia | 1.0 /100 | #263 | Tragic 26.7% |
| Taiwanese | 0.9 /100 | #264 | Tragic 26.7% |
| Chippewa | 0.9 /100 | #265 | Tragic 26.7% |
| Maltese | 0.9 /100 | #266 | Tragic 26.7% |
| Immigrants | Uzbekistan | 0.9 /100 | #267 | Tragic 26.7% |
| Immigrants | Belgium | 0.9 /100 | #268 | Tragic 26.7% |
Demographics Similar to Immigrants from Greece by Family Households with Children
In terms of family households with children, the demographic groups most similar to Immigrants from Greece are British West Indian (26.0%, a difference of 0.010%), Tlingit-Haida (26.0%, a difference of 0.030%), Immigrants from Australia (26.0%, a difference of 0.030%), Immigrants from France (26.0%, a difference of 0.040%), and Chinese (26.0%, a difference of 0.070%).
| Demographics | Rating | Rank | Family Households with Children |
| Immigrants | Norway | 0.0 /100 | #315 | Tragic 26.1% |
| Estonians | 0.0 /100 | #316 | Tragic 26.1% |
| Ottawa | 0.0 /100 | #317 | Tragic 26.1% |
| Iroquois | 0.0 /100 | #318 | Tragic 26.1% |
| Immigrants | France | 0.0 /100 | #319 | Tragic 26.0% |
| Tlingit-Haida | 0.0 /100 | #320 | Tragic 26.0% |
| British West Indians | 0.0 /100 | #321 | Tragic 26.0% |
| Immigrants | Greece | 0.0 /100 | #322 | Tragic 26.0% |
| Immigrants | Australia | 0.0 /100 | #323 | Tragic 26.0% |
| Chinese | 0.0 /100 | #324 | Tragic 26.0% |
| Barbadians | 0.0 /100 | #325 | Tragic 26.0% |
| Immigrants | Ireland | 0.0 /100 | #326 | Tragic 26.0% |
| Immigrants | Barbados | 0.0 /100 | #327 | Tragic 26.0% |
| Immigrants | Albania | 0.0 /100 | #328 | Tragic 25.9% |
| Cypriots | 0.0 /100 | #329 | Tragic 25.9% |