Immigrants from the Azores vs Russian Single Male Poverty
COMPARE
Immigrants from the Azores
Russian
Single Male Poverty
Single Male Poverty Comparison
Immigrants from the Azores
Russians
13.2%
SINGLE MALE POVERTY
9.3/ 100
METRIC RATING
223rd/ 347
METRIC RANK
12.5%
SINGLE MALE POVERTY
87.3/ 100
METRIC RATING
124th/ 347
METRIC RANK
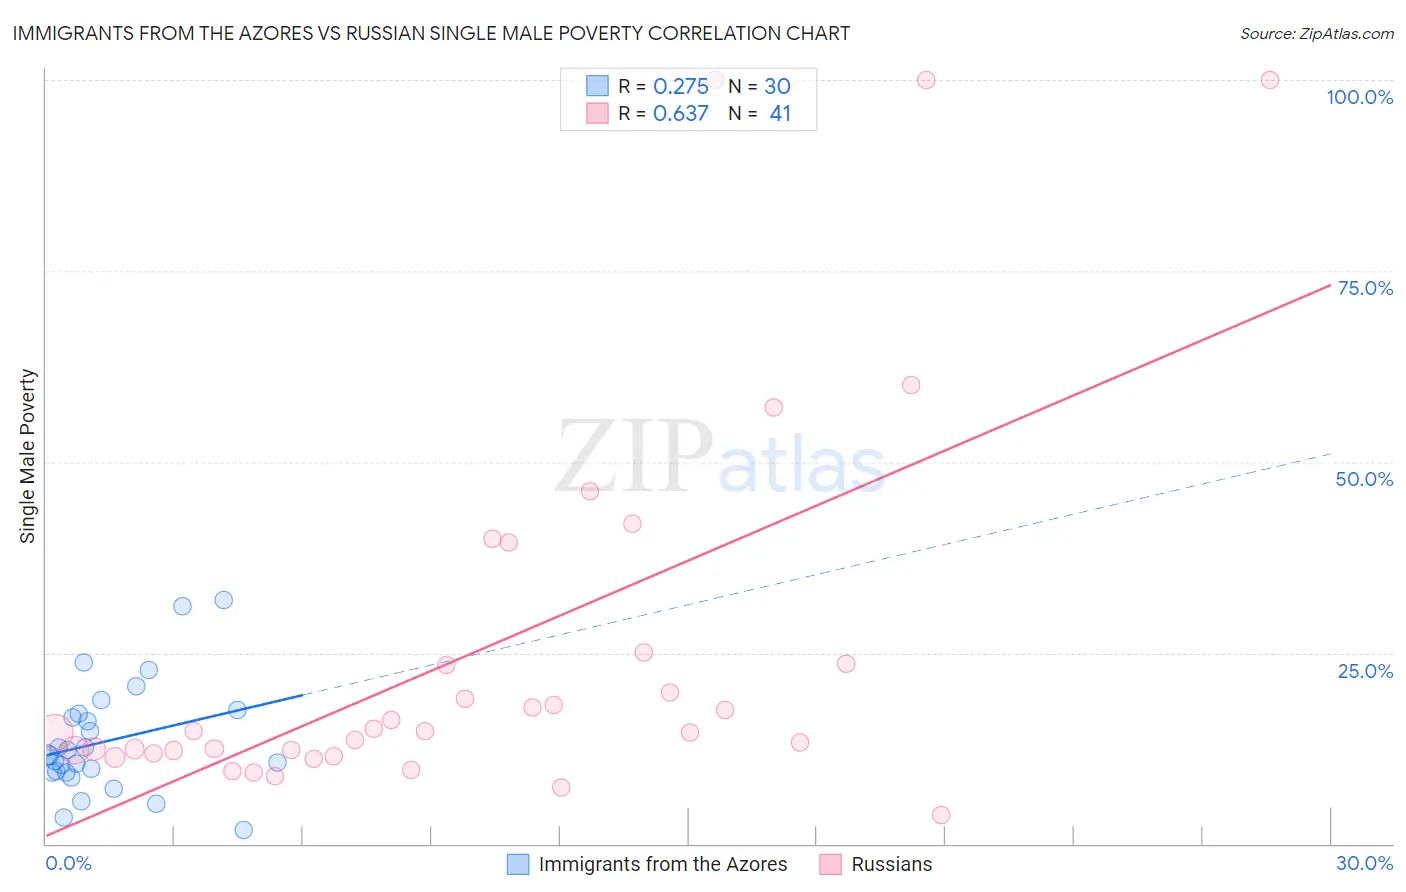
Immigrants from the Azores vs Russian Single Male Poverty Correlation Chart
The statistical analysis conducted on geographies consisting of 43,584,475 people shows a weak positive correlation between the proportion of Immigrants from the Azores and poverty level among single males in the United States with a correlation coefficient (R) of 0.275 and weighted average of 13.2%. Similarly, the statistical analysis conducted on geographies consisting of 432,544,064 people shows a significant positive correlation between the proportion of Russians and poverty level among single males in the United States with a correlation coefficient (R) of 0.637 and weighted average of 12.5%, a difference of 5.7%.
Single Male Poverty Correlation Summary
| Measurement | Immigrants from the Azores | Russian |
| Minimum | 1.7% | 3.8% |
| Maximum | 31.9% | 100.0% |
| Range | 30.2% | 96.2% |
| Mean | 13.5% | 25.2% |
| Median | 11.6% | 14.7% |
| Interquartile 25% (IQ1) | 9.3% | 12.0% |
| Interquartile 75% (IQ3) | 17.1% | 24.3% |
| Interquartile Range (IQR) | 7.8% | 12.2% |
| Standard Deviation (Sample) | 7.2% | 24.9% |
| Standard Deviation (Population) | 7.1% | 24.6% |
Similar Demographics by Single Male Poverty
Demographics Similar to Immigrants from the Azores by Single Male Poverty
In terms of single male poverty, the demographic groups most similar to Immigrants from the Azores are Somali (13.2%, a difference of 0.030%), Immigrants from Denmark (13.2%, a difference of 0.090%), Immigrants from Western Europe (13.2%, a difference of 0.11%), New Zealander (13.2%, a difference of 0.20%), and Central American (13.2%, a difference of 0.23%).
| Demographics | Rating | Rank | Single Male Poverty |
| Austrians | 13.9 /100 | #216 | Poor 13.1% |
| Bermudans | 13.0 /100 | #217 | Poor 13.1% |
| Scandinavians | 12.9 /100 | #218 | Poor 13.1% |
| Immigrants | Burma/Myanmar | 12.6 /100 | #219 | Poor 13.1% |
| Central Americans | 10.9 /100 | #220 | Poor 13.2% |
| New Zealanders | 10.7 /100 | #221 | Poor 13.2% |
| Immigrants | Western Europe | 10.0 /100 | #222 | Poor 13.2% |
| Immigrants | Azores | 9.3 /100 | #223 | Tragic 13.2% |
| Somalis | 9.1 /100 | #224 | Tragic 13.2% |
| Immigrants | Denmark | 8.7 /100 | #225 | Tragic 13.2% |
| Jamaicans | 7.7 /100 | #226 | Tragic 13.2% |
| Haitians | 7.0 /100 | #227 | Tragic 13.2% |
| Lebanese | 6.6 /100 | #228 | Tragic 13.2% |
| Europeans | 6.2 /100 | #229 | Tragic 13.3% |
| Ghanaians | 6.1 /100 | #230 | Tragic 13.3% |
Demographics Similar to Russians by Single Male Poverty
In terms of single male poverty, the demographic groups most similar to Russians are Immigrants from Kenya (12.5%, a difference of 0.030%), Immigrants from Jordan (12.5%, a difference of 0.030%), Serbian (12.5%, a difference of 0.070%), Romanian (12.5%, a difference of 0.11%), and Icelander (12.5%, a difference of 0.12%).
| Demographics | Rating | Rank | Single Male Poverty |
| Immigrants | Oceania | 91.1 /100 | #117 | Exceptional 12.4% |
| Albanians | 90.6 /100 | #118 | Exceptional 12.4% |
| Immigrants | Albania | 90.3 /100 | #119 | Exceptional 12.4% |
| Venezuelans | 89.4 /100 | #120 | Excellent 12.4% |
| Icelanders | 88.2 /100 | #121 | Excellent 12.5% |
| Serbians | 87.9 /100 | #122 | Excellent 12.5% |
| Immigrants | Kenya | 87.6 /100 | #123 | Excellent 12.5% |
| Russians | 87.3 /100 | #124 | Excellent 12.5% |
| Immigrants | Jordan | 87.1 /100 | #125 | Excellent 12.5% |
| Romanians | 86.4 /100 | #126 | Excellent 12.5% |
| Immigrants | Netherlands | 86.2 /100 | #127 | Excellent 12.5% |
| Ecuadorians | 85.9 /100 | #128 | Excellent 12.5% |
| Immigrants | Sierra Leone | 85.5 /100 | #129 | Excellent 12.5% |
| Immigrants | Nicaragua | 84.8 /100 | #130 | Excellent 12.5% |
| Immigrants | Northern Europe | 83.7 /100 | #131 | Excellent 12.5% |