Immigrants from the Azores vs Vietnamese Single Male Poverty
COMPARE
Immigrants from the Azores
Vietnamese
Single Male Poverty
Single Male Poverty Comparison
Immigrants from the Azores
Vietnamese
13.2%
SINGLE MALE POVERTY
9.3/ 100
METRIC RATING
223rd/ 347
METRIC RANK
12.7%
SINGLE MALE POVERTY
67.9/ 100
METRIC RATING
156th/ 347
METRIC RANK
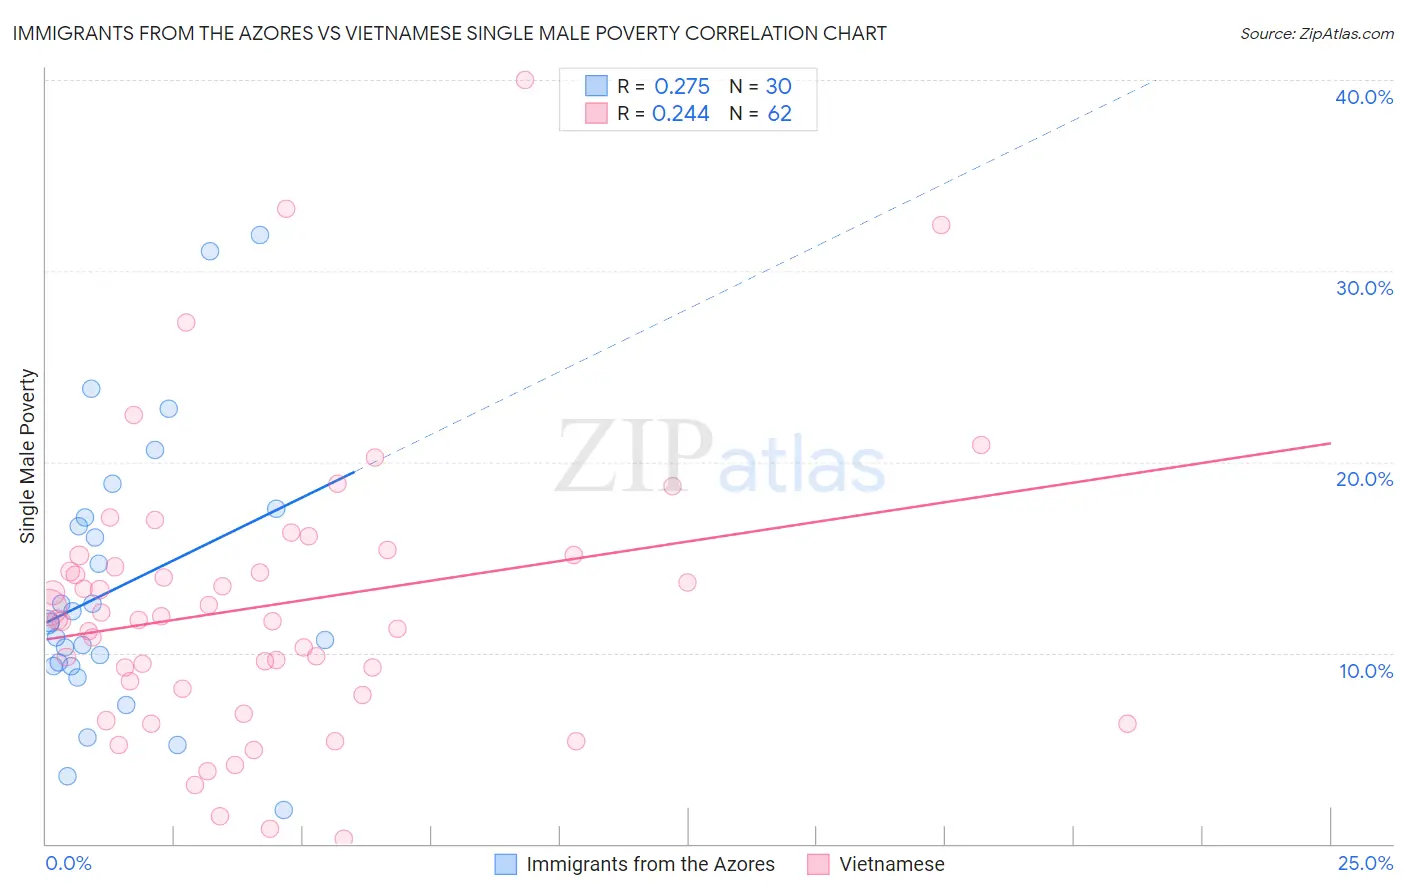
Immigrants from the Azores vs Vietnamese Single Male Poverty Correlation Chart
The statistical analysis conducted on geographies consisting of 43,584,475 people shows a weak positive correlation between the proportion of Immigrants from the Azores and poverty level among single males in the United States with a correlation coefficient (R) of 0.275 and weighted average of 13.2%. Similarly, the statistical analysis conducted on geographies consisting of 159,434,170 people shows a weak positive correlation between the proportion of Vietnamese and poverty level among single males in the United States with a correlation coefficient (R) of 0.244 and weighted average of 12.7%, a difference of 4.0%.
Single Male Poverty Correlation Summary
| Measurement | Immigrants from the Azores | Vietnamese |
| Minimum | 1.7% | 0.23% |
| Maximum | 31.9% | 40.0% |
| Range | 30.2% | 39.8% |
| Mean | 13.5% | 12.5% |
| Median | 11.6% | 11.7% |
| Interquartile 25% (IQ1) | 9.3% | 8.1% |
| Interquartile 75% (IQ3) | 17.1% | 15.1% |
| Interquartile Range (IQR) | 7.8% | 7.0% |
| Standard Deviation (Sample) | 7.2% | 7.4% |
| Standard Deviation (Population) | 7.1% | 7.4% |
Similar Demographics by Single Male Poverty
Demographics Similar to Immigrants from the Azores by Single Male Poverty
In terms of single male poverty, the demographic groups most similar to Immigrants from the Azores are Somali (13.2%, a difference of 0.030%), Immigrants from Denmark (13.2%, a difference of 0.090%), Immigrants from Western Europe (13.2%, a difference of 0.11%), New Zealander (13.2%, a difference of 0.20%), and Central American (13.2%, a difference of 0.23%).
| Demographics | Rating | Rank | Single Male Poverty |
| Austrians | 13.9 /100 | #216 | Poor 13.1% |
| Bermudans | 13.0 /100 | #217 | Poor 13.1% |
| Scandinavians | 12.9 /100 | #218 | Poor 13.1% |
| Immigrants | Burma/Myanmar | 12.6 /100 | #219 | Poor 13.1% |
| Central Americans | 10.9 /100 | #220 | Poor 13.2% |
| New Zealanders | 10.7 /100 | #221 | Poor 13.2% |
| Immigrants | Western Europe | 10.0 /100 | #222 | Poor 13.2% |
| Immigrants | Azores | 9.3 /100 | #223 | Tragic 13.2% |
| Somalis | 9.1 /100 | #224 | Tragic 13.2% |
| Immigrants | Denmark | 8.7 /100 | #225 | Tragic 13.2% |
| Jamaicans | 7.7 /100 | #226 | Tragic 13.2% |
| Haitians | 7.0 /100 | #227 | Tragic 13.2% |
| Lebanese | 6.6 /100 | #228 | Tragic 13.2% |
| Europeans | 6.2 /100 | #229 | Tragic 13.3% |
| Ghanaians | 6.1 /100 | #230 | Tragic 13.3% |
Demographics Similar to Vietnamese by Single Male Poverty
In terms of single male poverty, the demographic groups most similar to Vietnamese are Latvian (12.7%, a difference of 0.0%), Immigrants from Spain (12.7%, a difference of 0.040%), Immigrants from Scotland (12.7%, a difference of 0.060%), Immigrants (12.7%, a difference of 0.13%), and Immigrants from Middle Africa (12.7%, a difference of 0.18%).
| Demographics | Rating | Rank | Single Male Poverty |
| Sierra Leoneans | 73.0 /100 | #149 | Good 12.6% |
| Immigrants | Panama | 72.1 /100 | #150 | Good 12.6% |
| Immigrants | Hungary | 71.9 /100 | #151 | Good 12.6% |
| Australians | 71.4 /100 | #152 | Good 12.6% |
| Immigrants | Immigrants | 70.1 /100 | #153 | Good 12.7% |
| Immigrants | Scotland | 68.9 /100 | #154 | Good 12.7% |
| Immigrants | Spain | 68.7 /100 | #155 | Good 12.7% |
| Vietnamese | 67.9 /100 | #156 | Good 12.7% |
| Latvians | 67.9 /100 | #157 | Good 12.7% |
| Immigrants | Middle Africa | 64.9 /100 | #158 | Good 12.7% |
| Immigrants | Liberia | 64.2 /100 | #159 | Good 12.7% |
| Greeks | 64.1 /100 | #160 | Good 12.7% |
| Immigrants | Africa | 63.4 /100 | #161 | Good 12.7% |
| Eastern Europeans | 63.3 /100 | #162 | Good 12.7% |
| Palestinians | 63.1 /100 | #163 | Good 12.7% |