Immigrants from Austria vs English Seniors Poverty Over the Age of 65
COMPARE
Immigrants from Austria
English
Seniors Poverty Over the Age of 65
Seniors Poverty Over the Age of 65 Comparison
Immigrants from Austria
English
9.9%
SENIORS POVERTY OVER THE AGE OF 65
98.6/ 100
METRIC RATING
67th/ 347
METRIC RANK
9.1%
SENIORS POVERTY OVER THE AGE OF 65
100.0/ 100
METRIC RATING
9th/ 347
METRIC RANK
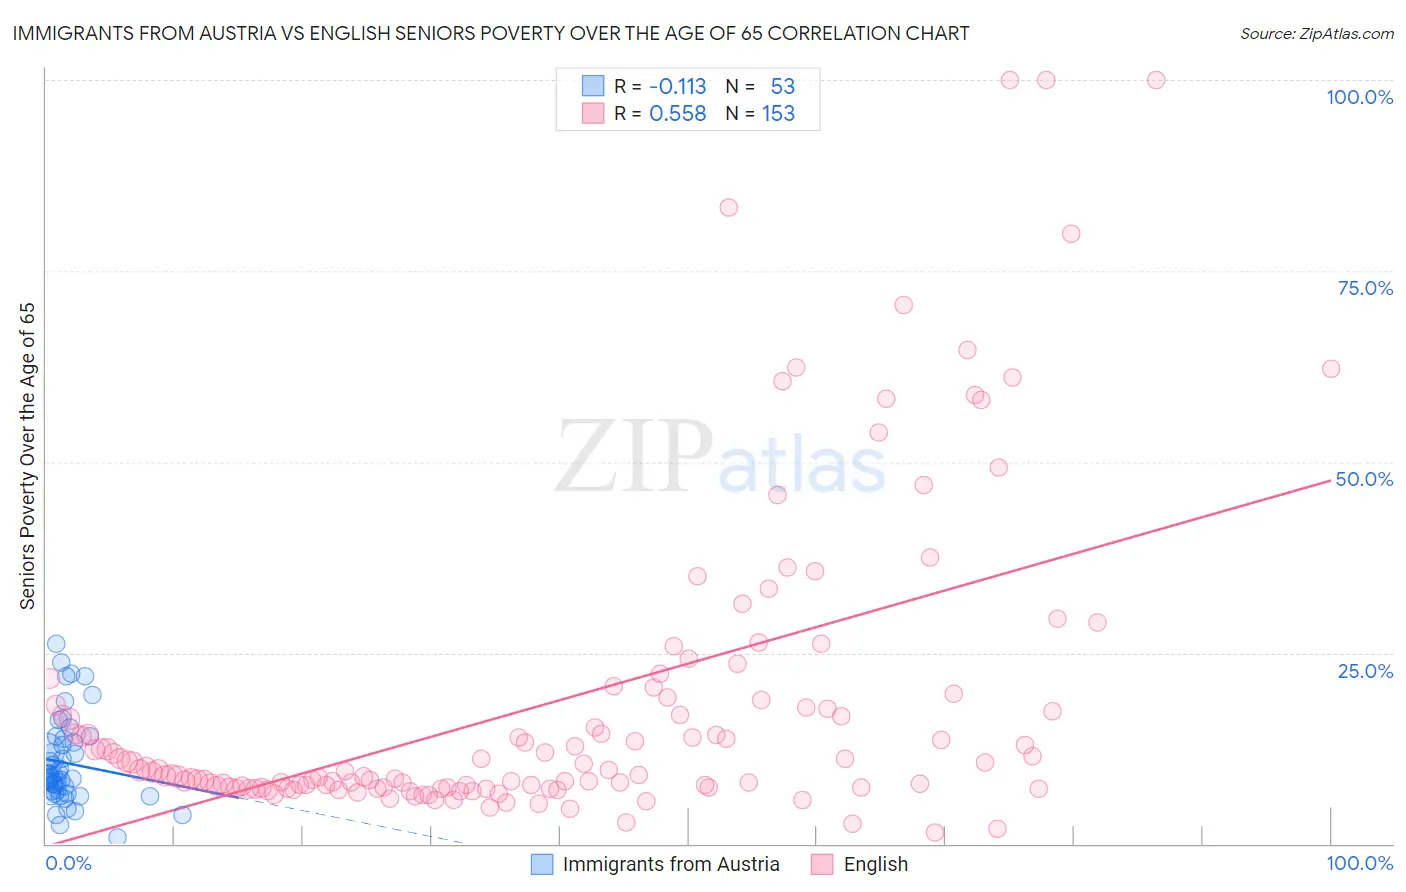
Immigrants from Austria vs English Seniors Poverty Over the Age of 65 Correlation Chart
The statistical analysis conducted on geographies consisting of 167,803,456 people shows a poor negative correlation between the proportion of Immigrants from Austria and poverty level among seniors over the age of 65 in the United States with a correlation coefficient (R) of -0.113 and weighted average of 9.9%. Similarly, the statistical analysis conducted on geographies consisting of 572,999,427 people shows a substantial positive correlation between the proportion of English and poverty level among seniors over the age of 65 in the United States with a correlation coefficient (R) of 0.558 and weighted average of 9.1%, a difference of 9.3%.
Seniors Poverty Over the Age of 65 Correlation Summary
| Measurement | Immigrants from Austria | English |
| Minimum | 0.86% | 1.4% |
| Maximum | 26.2% | 100.0% |
| Range | 25.3% | 98.6% |
| Mean | 10.6% | 18.4% |
| Median | 8.9% | 9.6% |
| Interquartile 25% (IQ1) | 6.7% | 7.4% |
| Interquartile 75% (IQ3) | 13.5% | 18.5% |
| Interquartile Range (IQR) | 6.8% | 11.1% |
| Standard Deviation (Sample) | 5.6% | 20.2% |
| Standard Deviation (Population) | 5.6% | 20.1% |
Similar Demographics by Seniors Poverty Over the Age of 65
Demographics Similar to Immigrants from Austria by Seniors Poverty Over the Age of 65
In terms of seniors poverty over the age of 65, the demographic groups most similar to Immigrants from Austria are Immigrants from Netherlands (9.9%, a difference of 0.10%), Pennsylvania German (9.9%, a difference of 0.15%), Canadian (9.9%, a difference of 0.22%), Australian (9.9%, a difference of 0.37%), and Immigrants from North America (9.9%, a difference of 0.44%).
| Demographics | Rating | Rank | Seniors Poverty Over the Age of 65 |
| Celtics | 99.0 /100 | #60 | Exceptional 9.8% |
| Iranians | 98.9 /100 | #61 | Exceptional 9.8% |
| French Canadians | 98.9 /100 | #62 | Exceptional 9.8% |
| Macedonians | 98.8 /100 | #63 | Exceptional 9.9% |
| Immigrants | North America | 98.8 /100 | #64 | Exceptional 9.9% |
| Pennsylvania Germans | 98.7 /100 | #65 | Exceptional 9.9% |
| Immigrants | Netherlands | 98.7 /100 | #66 | Exceptional 9.9% |
| Immigrants | Austria | 98.6 /100 | #67 | Exceptional 9.9% |
| Canadians | 98.5 /100 | #68 | Exceptional 9.9% |
| Australians | 98.4 /100 | #69 | Exceptional 9.9% |
| Samoans | 98.0 /100 | #70 | Exceptional 10.0% |
| Yugoslavians | 97.9 /100 | #71 | Exceptional 10.0% |
| Palestinians | 97.9 /100 | #72 | Exceptional 10.0% |
| Russians | 97.9 /100 | #73 | Exceptional 10.0% |
| Turks | 97.9 /100 | #74 | Exceptional 10.0% |
Demographics Similar to English by Seniors Poverty Over the Age of 65
In terms of seniors poverty over the age of 65, the demographic groups most similar to English are Lithuanian (9.1%, a difference of 0.10%), Maltese (9.1%, a difference of 0.52%), Czech (9.0%, a difference of 0.67%), Scandinavian (9.1%, a difference of 0.71%), and Croatian (9.1%, a difference of 0.75%).
| Demographics | Rating | Rank | Seniors Poverty Over the Age of 65 |
| Tlingit-Haida | 100.0 /100 | #2 | Exceptional 8.3% |
| Norwegians | 100.0 /100 | #3 | Exceptional 8.7% |
| Swedes | 100.0 /100 | #4 | Exceptional 8.7% |
| Immigrants | India | 100.0 /100 | #5 | Exceptional 8.8% |
| Danes | 100.0 /100 | #6 | Exceptional 8.8% |
| Germans | 100.0 /100 | #7 | Exceptional 9.0% |
| Czechs | 100.0 /100 | #8 | Exceptional 9.0% |
| English | 100.0 /100 | #9 | Exceptional 9.1% |
| Lithuanians | 100.0 /100 | #10 | Exceptional 9.1% |
| Maltese | 99.9 /100 | #11 | Exceptional 9.1% |
| Scandinavians | 99.9 /100 | #12 | Exceptional 9.1% |
| Croatians | 99.9 /100 | #13 | Exceptional 9.1% |
| Poles | 99.9 /100 | #14 | Exceptional 9.1% |
| Dutch | 99.9 /100 | #15 | Exceptional 9.1% |
| Europeans | 99.9 /100 | #16 | Exceptional 9.2% |