Immigrants from Austria vs Fijian Family Households
COMPARE
Immigrants from Austria
Fijian
Family Households
Family Households Comparison
Immigrants from Austria
Fijians
63.1%
FAMILY HOUSEHOLDS
0.3/ 100
METRIC RATING
270th/ 347
METRIC RANK
65.9%
FAMILY HOUSEHOLDS
99.9/ 100
METRIC RATING
66th/ 347
METRIC RANK
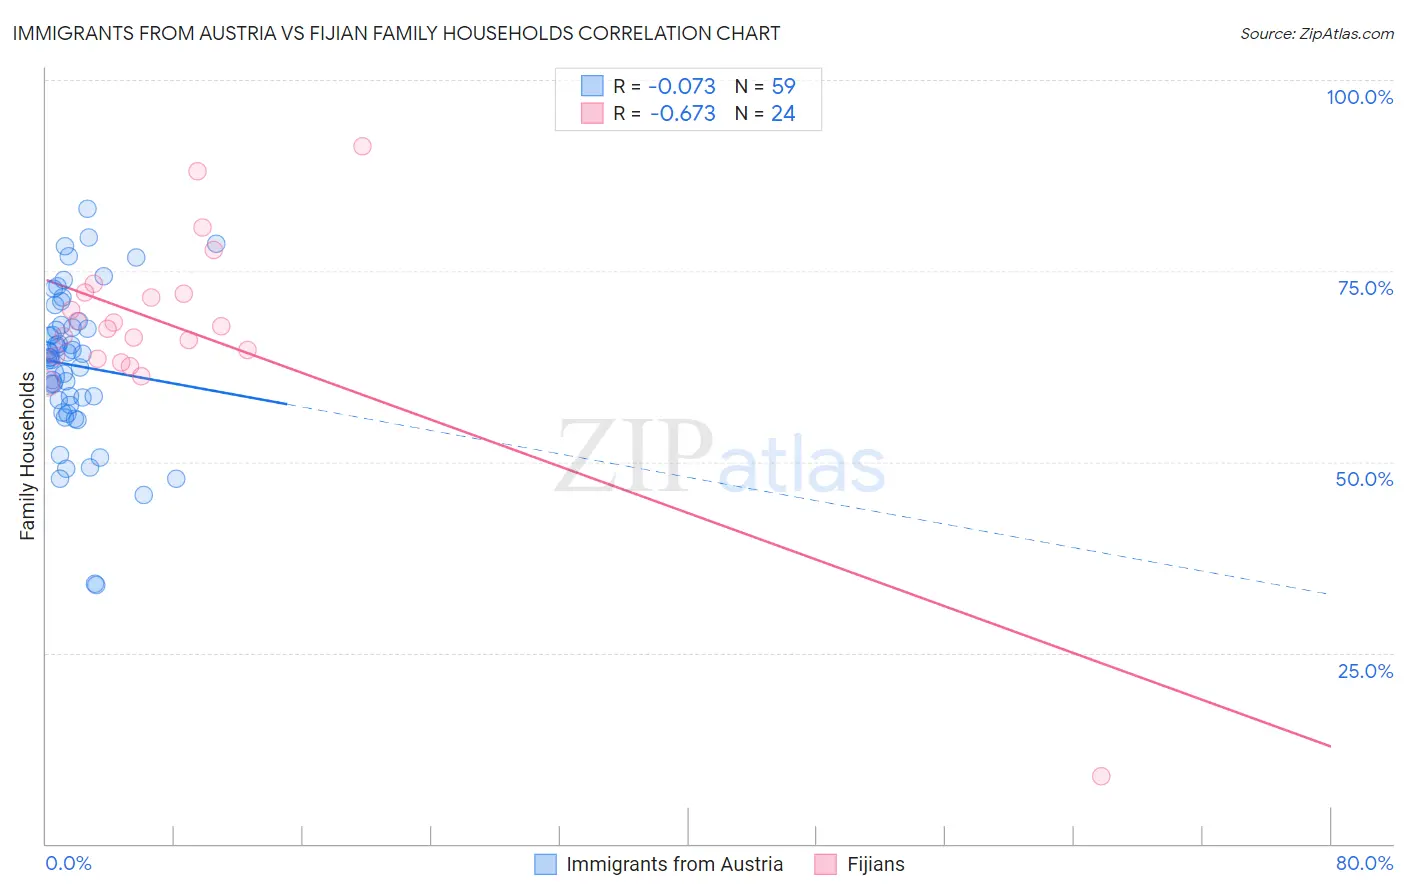
Immigrants from Austria vs Fijian Family Households Correlation Chart
The statistical analysis conducted on geographies consisting of 167,966,875 people shows a slight negative correlation between the proportion of Immigrants from Austria and percentage of family households in the United States with a correlation coefficient (R) of -0.073 and weighted average of 63.1%. Similarly, the statistical analysis conducted on geographies consisting of 55,947,966 people shows a significant negative correlation between the proportion of Fijians and percentage of family households in the United States with a correlation coefficient (R) of -0.673 and weighted average of 65.9%, a difference of 4.5%.
Family Households Correlation Summary
| Measurement | Immigrants from Austria | Fijian |
| Minimum | 33.9% | 8.8% |
| Maximum | 83.1% | 91.4% |
| Range | 49.2% | 82.6% |
| Mean | 62.6% | 67.3% |
| Median | 63.7% | 67.6% |
| Interquartile 25% (IQ1) | 57.4% | 63.7% |
| Interquartile 75% (IQ3) | 67.9% | 72.0% |
| Interquartile Range (IQR) | 10.5% | 8.4% |
| Standard Deviation (Sample) | 10.0% | 14.7% |
| Standard Deviation (Population) | 10.0% | 14.4% |
Similar Demographics by Family Households
Demographics Similar to Immigrants from Austria by Family Households
In terms of family households, the demographic groups most similar to Immigrants from Austria are Immigrants from Croatia (63.1%, a difference of 0.010%), Immigrants from Turkey (63.1%, a difference of 0.010%), Immigrants from Singapore (63.1%, a difference of 0.020%), Yugoslavian (63.1%, a difference of 0.020%), and Immigrants from Kazakhstan (63.1%, a difference of 0.020%).
| Demographics | Rating | Rank | Family Households |
| Cheyenne | 0.5 /100 | #263 | Tragic 63.2% |
| Kenyans | 0.5 /100 | #264 | Tragic 63.2% |
| Colville | 0.5 /100 | #265 | Tragic 63.2% |
| Immigrants | Western Africa | 0.5 /100 | #266 | Tragic 63.1% |
| Israelis | 0.4 /100 | #267 | Tragic 63.1% |
| Immigrants | Singapore | 0.4 /100 | #268 | Tragic 63.1% |
| Yugoslavians | 0.4 /100 | #269 | Tragic 63.1% |
| Immigrants | Austria | 0.3 /100 | #270 | Tragic 63.1% |
| Immigrants | Croatia | 0.3 /100 | #271 | Tragic 63.1% |
| Immigrants | Turkey | 0.3 /100 | #272 | Tragic 63.1% |
| Immigrants | Kazakhstan | 0.3 /100 | #273 | Tragic 63.1% |
| Lumbee | 0.3 /100 | #274 | Tragic 63.1% |
| West Indians | 0.3 /100 | #275 | Tragic 63.1% |
| Serbians | 0.3 /100 | #276 | Tragic 63.0% |
| Ottawa | 0.3 /100 | #277 | Tragic 63.0% |
Demographics Similar to Fijians by Family Households
In terms of family households, the demographic groups most similar to Fijians are Filipino (65.9%, a difference of 0.0%), Japanese (65.9%, a difference of 0.020%), Costa Rican (65.9%, a difference of 0.040%), Pima (65.9%, a difference of 0.050%), and Malaysian (65.9%, a difference of 0.050%).
| Demographics | Rating | Rank | Family Households |
| Immigrants | Korea | 100.0 /100 | #59 | Exceptional 66.0% |
| South Americans | 100.0 /100 | #60 | Exceptional 66.0% |
| Danes | 100.0 /100 | #61 | Exceptional 66.0% |
| Central Americans | 100.0 /100 | #62 | Exceptional 66.0% |
| Immigrants | Indonesia | 100.0 /100 | #63 | Exceptional 66.0% |
| Pima | 99.9 /100 | #64 | Exceptional 65.9% |
| Costa Ricans | 99.9 /100 | #65 | Exceptional 65.9% |
| Fijians | 99.9 /100 | #66 | Exceptional 65.9% |
| Filipinos | 99.9 /100 | #67 | Exceptional 65.9% |
| Japanese | 99.9 /100 | #68 | Exceptional 65.9% |
| Malaysians | 99.9 /100 | #69 | Exceptional 65.9% |
| Immigrants | Afghanistan | 99.9 /100 | #70 | Exceptional 65.9% |
| Bhutanese | 99.9 /100 | #71 | Exceptional 65.9% |
| Portuguese | 99.9 /100 | #72 | Exceptional 65.8% |
| Laotians | 99.9 /100 | #73 | Exceptional 65.8% |