Immigrants from Asia vs Immigrants from Liberia Child Poverty Among Boys Under 16
COMPARE
Immigrants from Asia
Immigrants from Liberia
Child Poverty Among Boys Under 16
Child Poverty Among Boys Under 16 Comparison
Immigrants from Asia
Immigrants from Liberia
13.9%
CHILD POVERTY AMONG BOYS UNDER 16
99.6/ 100
METRIC RATING
40th/ 347
METRIC RANK
19.3%
CHILD POVERTY AMONG BOYS UNDER 16
0.2/ 100
METRIC RATING
256th/ 347
METRIC RANK
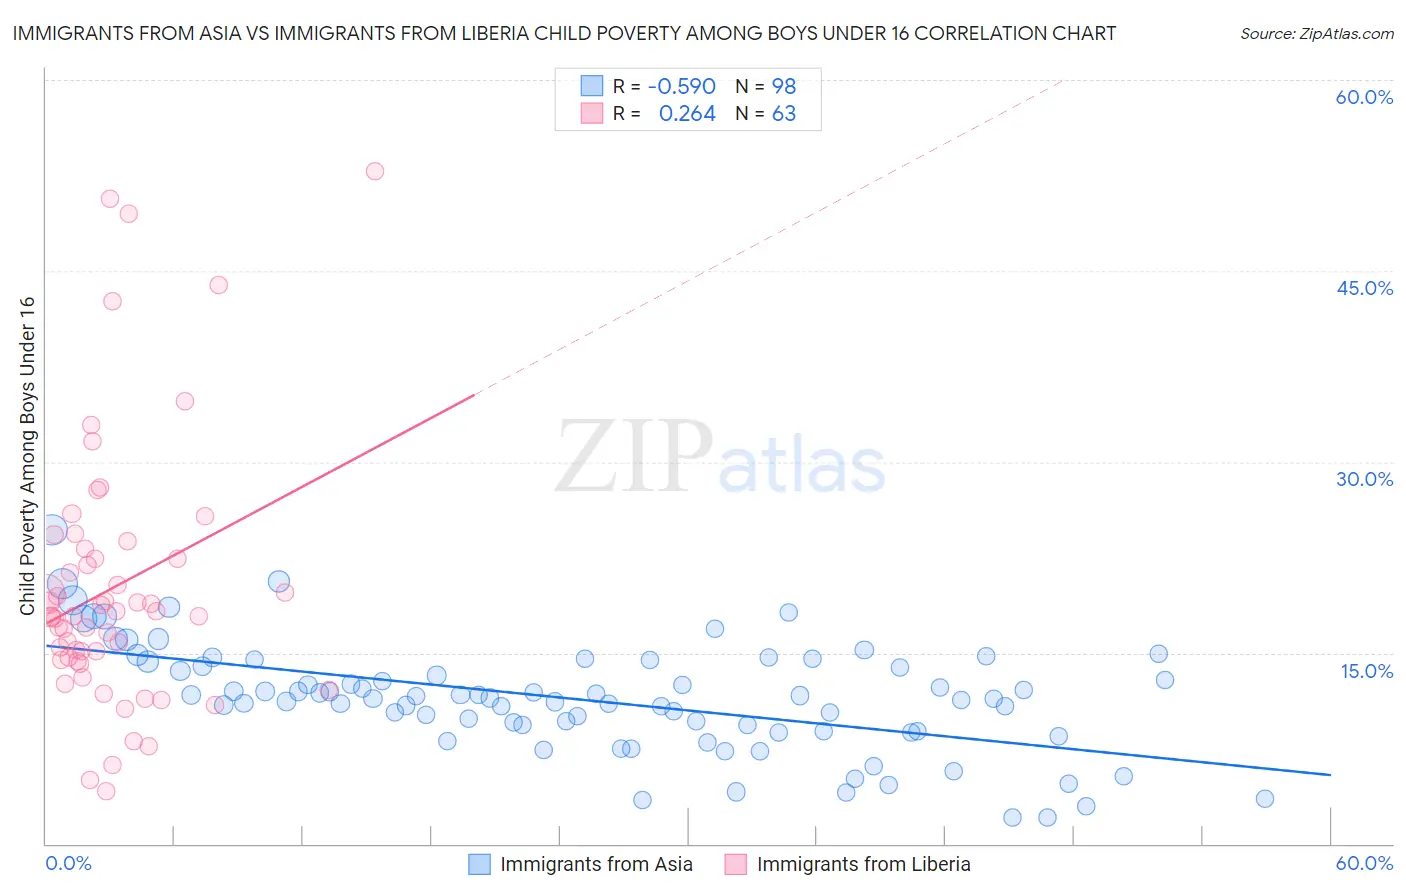
Immigrants from Asia vs Immigrants from Liberia Child Poverty Among Boys Under 16 Correlation Chart
The statistical analysis conducted on geographies consisting of 532,124,226 people shows a substantial negative correlation between the proportion of Immigrants from Asia and poverty level among boys under the age of 16 in the United States with a correlation coefficient (R) of -0.590 and weighted average of 13.9%. Similarly, the statistical analysis conducted on geographies consisting of 134,835,664 people shows a weak positive correlation between the proportion of Immigrants from Liberia and poverty level among boys under the age of 16 in the United States with a correlation coefficient (R) of 0.264 and weighted average of 19.3%, a difference of 38.7%.
Child Poverty Among Boys Under 16 Correlation Summary
| Measurement | Immigrants from Asia | Immigrants from Liberia |
| Minimum | 2.1% | 4.2% |
| Maximum | 24.7% | 52.8% |
| Range | 22.6% | 48.7% |
| Mean | 11.3% | 20.2% |
| Median | 11.4% | 17.9% |
| Interquartile 25% (IQ1) | 8.9% | 14.4% |
| Interquartile 75% (IQ3) | 14.0% | 23.2% |
| Interquartile Range (IQR) | 5.1% | 8.7% |
| Standard Deviation (Sample) | 4.2% | 10.3% |
| Standard Deviation (Population) | 4.2% | 10.2% |
Similar Demographics by Child Poverty Among Boys Under 16
Demographics Similar to Immigrants from Asia by Child Poverty Among Boys Under 16
In terms of child poverty among boys under 16, the demographic groups most similar to Immigrants from Asia are Lithuanian (14.0%, a difference of 0.090%), Korean (14.0%, a difference of 0.11%), Immigrants from Australia (13.9%, a difference of 0.24%), Immigrants from Northern Europe (13.9%, a difference of 0.38%), and Immigrants from Sri Lanka (13.9%, a difference of 0.53%).
| Demographics | Rating | Rank | Child Poverty Among Boys Under 16 |
| Danes | 99.8 /100 | #33 | Exceptional 13.6% |
| Assyrians/Chaldeans/Syriacs | 99.8 /100 | #34 | Exceptional 13.6% |
| Russians | 99.7 /100 | #35 | Exceptional 13.8% |
| Luxembourgers | 99.7 /100 | #36 | Exceptional 13.8% |
| Immigrants | Sri Lanka | 99.6 /100 | #37 | Exceptional 13.9% |
| Immigrants | Northern Europe | 99.6 /100 | #38 | Exceptional 13.9% |
| Immigrants | Australia | 99.6 /100 | #39 | Exceptional 13.9% |
| Immigrants | Asia | 99.6 /100 | #40 | Exceptional 13.9% |
| Lithuanians | 99.6 /100 | #41 | Exceptional 14.0% |
| Koreans | 99.6 /100 | #42 | Exceptional 14.0% |
| Croatians | 99.5 /100 | #43 | Exceptional 14.0% |
| Estonians | 99.4 /100 | #44 | Exceptional 14.1% |
| Immigrants | Scotland | 99.4 /100 | #45 | Exceptional 14.1% |
| Greeks | 99.4 /100 | #46 | Exceptional 14.1% |
| Immigrants | Moldova | 99.4 /100 | #47 | Exceptional 14.1% |
Demographics Similar to Immigrants from Liberia by Child Poverty Among Boys Under 16
In terms of child poverty among boys under 16, the demographic groups most similar to Immigrants from Liberia are Trinidadian and Tobagonian (19.3%, a difference of 0.030%), Ecuadorian (19.3%, a difference of 0.030%), Mexican American Indian (19.4%, a difference of 0.21%), Potawatomi (19.4%, a difference of 0.22%), and Spanish American (19.4%, a difference of 0.24%).
| Demographics | Rating | Rank | Child Poverty Among Boys Under 16 |
| Alsatians | 0.3 /100 | #249 | Tragic 19.1% |
| Immigrants | Burma/Myanmar | 0.2 /100 | #250 | Tragic 19.2% |
| French American Indians | 0.2 /100 | #251 | Tragic 19.2% |
| Immigrants | Western Africa | 0.2 /100 | #252 | Tragic 19.3% |
| Liberians | 0.2 /100 | #253 | Tragic 19.3% |
| Trinidadians and Tobagonians | 0.2 /100 | #254 | Tragic 19.3% |
| Ecuadorians | 0.2 /100 | #255 | Tragic 19.3% |
| Immigrants | Liberia | 0.2 /100 | #256 | Tragic 19.3% |
| Mexican American Indians | 0.2 /100 | #257 | Tragic 19.4% |
| Potawatomi | 0.2 /100 | #258 | Tragic 19.4% |
| Spanish Americans | 0.2 /100 | #259 | Tragic 19.4% |
| Shoshone | 0.2 /100 | #260 | Tragic 19.4% |
| Immigrants | Ghana | 0.2 /100 | #261 | Tragic 19.4% |
| Immigrants | Guyana | 0.1 /100 | #262 | Tragic 19.5% |
| Ottawa | 0.1 /100 | #263 | Tragic 19.5% |