Alaskan Athabascan vs Immigrants from Liberia Child Poverty Among Boys Under 16
COMPARE
Alaskan Athabascan
Immigrants from Liberia
Child Poverty Among Boys Under 16
Child Poverty Among Boys Under 16 Comparison
Alaskan Athabascans
Immigrants from Liberia
17.6%
CHILD POVERTY AMONG BOYS UNDER 16
7.3/ 100
METRIC RATING
209th/ 347
METRIC RANK
19.3%
CHILD POVERTY AMONG BOYS UNDER 16
0.2/ 100
METRIC RATING
256th/ 347
METRIC RANK
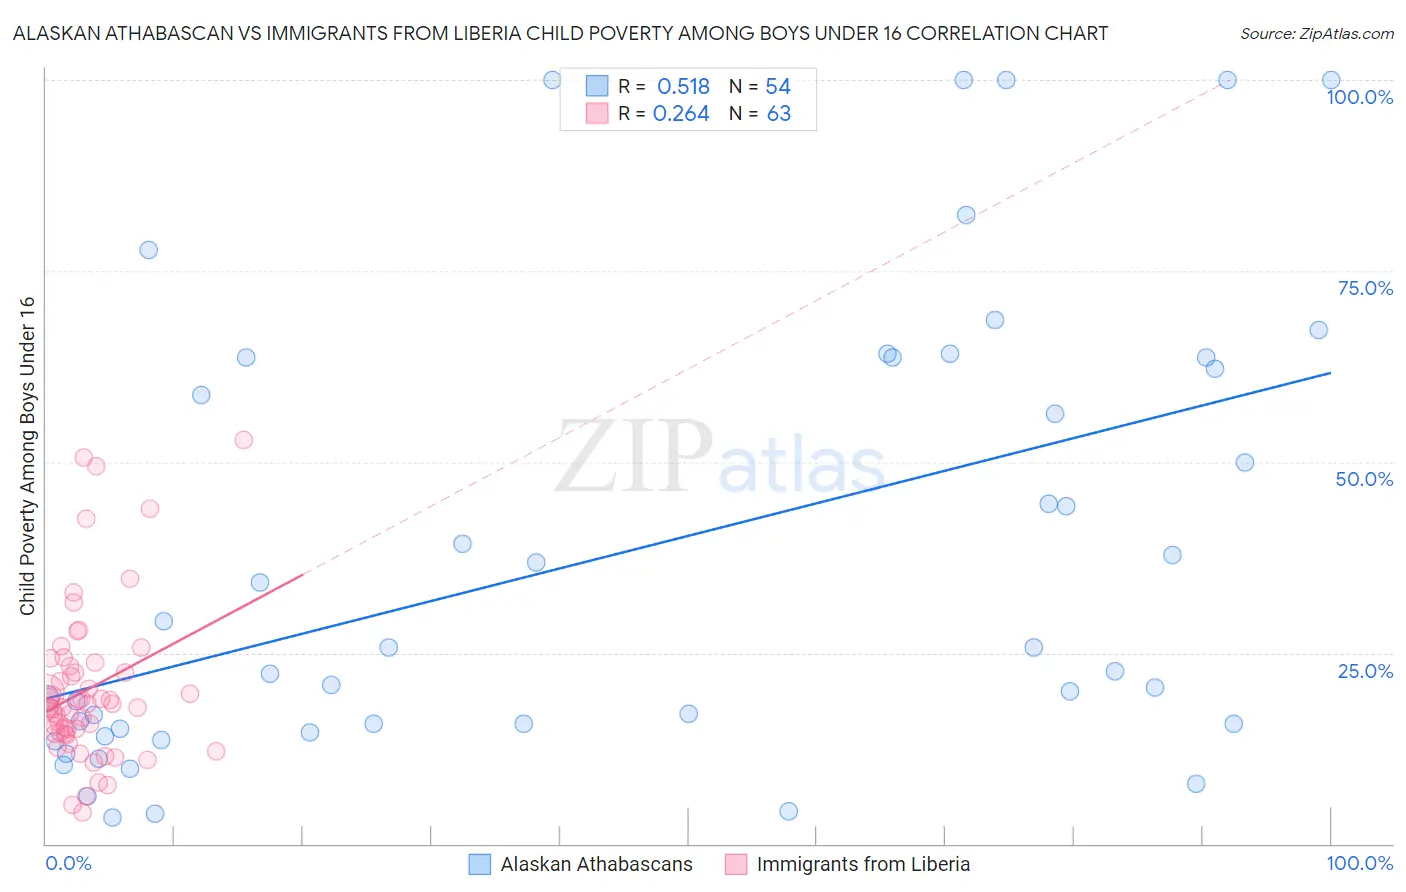
Alaskan Athabascan vs Immigrants from Liberia Child Poverty Among Boys Under 16 Correlation Chart
The statistical analysis conducted on geographies consisting of 45,576,006 people shows a substantial positive correlation between the proportion of Alaskan Athabascans and poverty level among boys under the age of 16 in the United States with a correlation coefficient (R) of 0.518 and weighted average of 17.6%. Similarly, the statistical analysis conducted on geographies consisting of 134,835,664 people shows a weak positive correlation between the proportion of Immigrants from Liberia and poverty level among boys under the age of 16 in the United States with a correlation coefficient (R) of 0.264 and weighted average of 19.3%, a difference of 9.8%.
Child Poverty Among Boys Under 16 Correlation Summary
| Measurement | Alaskan Athabascan | Immigrants from Liberia |
| Minimum | 3.4% | 4.2% |
| Maximum | 100.0% | 52.8% |
| Range | 96.6% | 48.7% |
| Mean | 37.8% | 20.2% |
| Median | 24.1% | 17.9% |
| Interquartile 25% (IQ1) | 15.0% | 14.4% |
| Interquartile 75% (IQ3) | 63.6% | 23.2% |
| Interquartile Range (IQR) | 48.6% | 8.7% |
| Standard Deviation (Sample) | 29.5% | 10.3% |
| Standard Deviation (Population) | 29.2% | 10.2% |
Similar Demographics by Child Poverty Among Boys Under 16
Demographics Similar to Alaskan Athabascans by Child Poverty Among Boys Under 16
In terms of child poverty among boys under 16, the demographic groups most similar to Alaskan Athabascans are Malaysian (17.6%, a difference of 0.11%), Immigrants from Armenia (17.6%, a difference of 0.18%), Immigrants (17.6%, a difference of 0.24%), Aleut (17.7%, a difference of 0.29%), and Immigrants from Thailand (17.5%, a difference of 0.32%).
| Demographics | Rating | Rank | Child Poverty Among Boys Under 16 |
| Immigrants | Sierra Leone | 13.4 /100 | #202 | Poor 17.3% |
| Immigrants | Uzbekistan | 13.3 /100 | #203 | Poor 17.3% |
| Ugandans | 12.5 /100 | #204 | Poor 17.3% |
| Immigrants | Portugal | 11.2 /100 | #205 | Poor 17.4% |
| German Russians | 10.9 /100 | #206 | Poor 17.4% |
| Immigrants | Thailand | 8.2 /100 | #207 | Tragic 17.5% |
| Malaysians | 7.6 /100 | #208 | Tragic 17.6% |
| Alaskan Athabascans | 7.3 /100 | #209 | Tragic 17.6% |
| Immigrants | Armenia | 6.8 /100 | #210 | Tragic 17.6% |
| Immigrants | Immigrants | 6.7 /100 | #211 | Tragic 17.6% |
| Aleuts | 6.6 /100 | #212 | Tragic 17.7% |
| Immigrants | Eastern Africa | 6.0 /100 | #213 | Tragic 17.7% |
| Panamanians | 5.9 /100 | #214 | Tragic 17.7% |
| Osage | 5.8 /100 | #215 | Tragic 17.7% |
| Moroccans | 5.6 /100 | #216 | Tragic 17.7% |
Demographics Similar to Immigrants from Liberia by Child Poverty Among Boys Under 16
In terms of child poverty among boys under 16, the demographic groups most similar to Immigrants from Liberia are Trinidadian and Tobagonian (19.3%, a difference of 0.030%), Ecuadorian (19.3%, a difference of 0.030%), Mexican American Indian (19.4%, a difference of 0.21%), Potawatomi (19.4%, a difference of 0.22%), and Spanish American (19.4%, a difference of 0.24%).
| Demographics | Rating | Rank | Child Poverty Among Boys Under 16 |
| Alsatians | 0.3 /100 | #249 | Tragic 19.1% |
| Immigrants | Burma/Myanmar | 0.2 /100 | #250 | Tragic 19.2% |
| French American Indians | 0.2 /100 | #251 | Tragic 19.2% |
| Immigrants | Western Africa | 0.2 /100 | #252 | Tragic 19.3% |
| Liberians | 0.2 /100 | #253 | Tragic 19.3% |
| Trinidadians and Tobagonians | 0.2 /100 | #254 | Tragic 19.3% |
| Ecuadorians | 0.2 /100 | #255 | Tragic 19.3% |
| Immigrants | Liberia | 0.2 /100 | #256 | Tragic 19.3% |
| Mexican American Indians | 0.2 /100 | #257 | Tragic 19.4% |
| Potawatomi | 0.2 /100 | #258 | Tragic 19.4% |
| Spanish Americans | 0.2 /100 | #259 | Tragic 19.4% |
| Shoshone | 0.2 /100 | #260 | Tragic 19.4% |
| Immigrants | Ghana | 0.2 /100 | #261 | Tragic 19.4% |
| Immigrants | Guyana | 0.1 /100 | #262 | Tragic 19.5% |
| Ottawa | 0.1 /100 | #263 | Tragic 19.5% |