Immigrants from South America vs Israeli Receiving Food Stamps
COMPARE
Immigrants from South America
Israeli
Receiving Food Stamps
Receiving Food Stamps Comparison
Immigrants from South America
Israelis
12.8%
RECEIVING FOOD STAMPS
6.5/ 100
METRIC RATING
216th/ 347
METRIC RANK
10.7%
RECEIVING FOOD STAMPS
92.4/ 100
METRIC RATING
130th/ 347
METRIC RANK
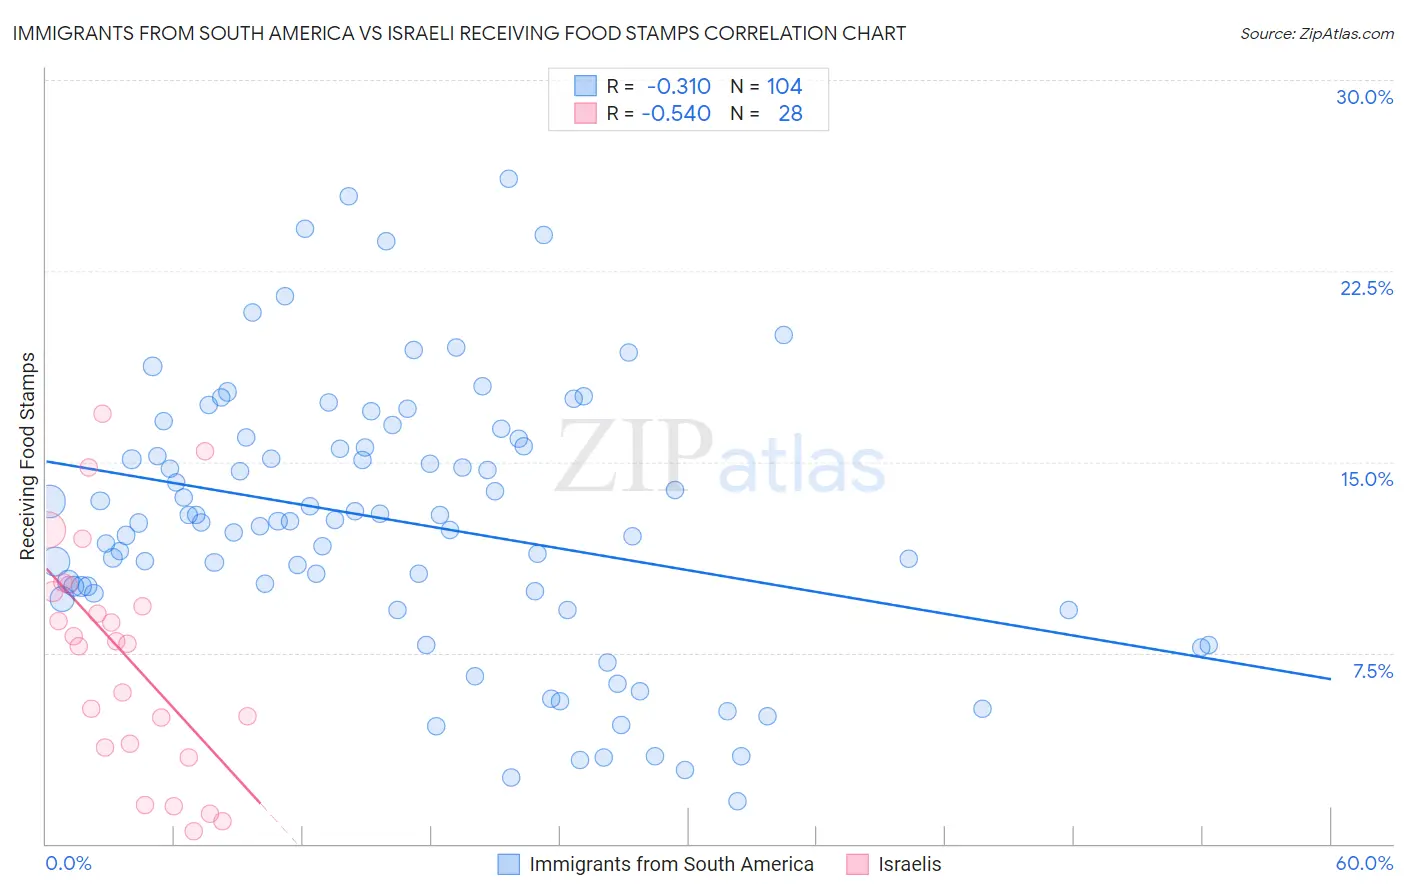
Immigrants from South America vs Israeli Receiving Food Stamps Correlation Chart
The statistical analysis conducted on geographies consisting of 484,382,726 people shows a mild negative correlation between the proportion of Immigrants from South America and percentage of population receiving government assistance and/or food stamps in the United States with a correlation coefficient (R) of -0.310 and weighted average of 12.8%. Similarly, the statistical analysis conducted on geographies consisting of 210,490,548 people shows a substantial negative correlation between the proportion of Israelis and percentage of population receiving government assistance and/or food stamps in the United States with a correlation coefficient (R) of -0.540 and weighted average of 10.7%, a difference of 19.8%.
Receiving Food Stamps Correlation Summary
| Measurement | Immigrants from South America | Israeli |
| Minimum | 1.7% | 0.50% |
| Maximum | 26.1% | 16.9% |
| Range | 24.5% | 16.4% |
| Mean | 12.6% | 7.4% |
| Median | 12.6% | 7.9% |
| Interquartile 25% (IQ1) | 9.9% | 3.9% |
| Interquartile 75% (IQ3) | 15.8% | 10.0% |
| Interquartile Range (IQR) | 5.9% | 6.2% |
| Standard Deviation (Sample) | 5.3% | 4.5% |
| Standard Deviation (Population) | 5.2% | 4.4% |
Similar Demographics by Receiving Food Stamps
Demographics Similar to Immigrants from South America by Receiving Food Stamps
In terms of receiving food stamps, the demographic groups most similar to Immigrants from South America are Native Hawaiian (12.8%, a difference of 0.11%), Immigrants from Burma/Myanmar (12.9%, a difference of 0.26%), Immigrants from Africa (12.8%, a difference of 0.55%), Moroccan (12.8%, a difference of 0.58%), and Hawaiian (12.9%, a difference of 0.63%).
| Demographics | Rating | Rank | Receiving Food Stamps |
| Immigrants | Sierra Leone | 12.9 /100 | #209 | Poor 12.5% |
| Immigrants | Uruguay | 12.8 /100 | #210 | Poor 12.5% |
| Colombians | 10.2 /100 | #211 | Poor 12.6% |
| Malaysians | 8.5 /100 | #212 | Tragic 12.7% |
| Moroccans | 7.6 /100 | #213 | Tragic 12.8% |
| Immigrants | Africa | 7.6 /100 | #214 | Tragic 12.8% |
| Native Hawaiians | 6.7 /100 | #215 | Tragic 12.8% |
| Immigrants | South America | 6.5 /100 | #216 | Tragic 12.8% |
| Immigrants | Burma/Myanmar | 6.0 /100 | #217 | Tragic 12.9% |
| Hawaiians | 5.4 /100 | #218 | Tragic 12.9% |
| Immigrants | Middle Africa | 5.4 /100 | #219 | Tragic 12.9% |
| Immigrants | Colombia | 5.3 /100 | #220 | Tragic 12.9% |
| Bermudans | 4.8 /100 | #221 | Tragic 13.0% |
| Immigrants | Immigrants | 4.4 /100 | #222 | Tragic 13.0% |
| Immigrants | Albania | 4.4 /100 | #223 | Tragic 13.0% |
Demographics Similar to Israelis by Receiving Food Stamps
In terms of receiving food stamps, the demographic groups most similar to Israelis are French (10.7%, a difference of 0.0%), Immigrants from Jordan (10.7%, a difference of 0.10%), Yugoslavian (10.7%, a difference of 0.10%), Immigrants from Ethiopia (10.7%, a difference of 0.11%), and Afghan (10.7%, a difference of 0.13%).
| Demographics | Rating | Rank | Receiving Food Stamps |
| Immigrants | Philippines | 93.3 /100 | #123 | Exceptional 10.7% |
| Paraguayans | 93.0 /100 | #124 | Exceptional 10.7% |
| Ukrainians | 92.8 /100 | #125 | Exceptional 10.7% |
| Afghans | 92.6 /100 | #126 | Exceptional 10.7% |
| Immigrants | Ethiopia | 92.6 /100 | #127 | Exceptional 10.7% |
| Immigrants | Jordan | 92.5 /100 | #128 | Exceptional 10.7% |
| Yugoslavians | 92.5 /100 | #129 | Exceptional 10.7% |
| Israelis | 92.4 /100 | #130 | Exceptional 10.7% |
| French | 92.3 /100 | #131 | Exceptional 10.7% |
| Immigrants | Germany | 92.0 /100 | #132 | Exceptional 10.7% |
| Immigrants | Russia | 90.9 /100 | #133 | Exceptional 10.8% |
| Immigrants | Brazil | 90.3 /100 | #134 | Exceptional 10.8% |
| Argentineans | 90.2 /100 | #135 | Exceptional 10.8% |
| Slovaks | 89.8 /100 | #136 | Excellent 10.8% |
| Immigrants | Eastern Europe | 89.8 /100 | #137 | Excellent 10.8% |