Immigrants from Guyana vs Immigrants from Uganda Family Poverty
COMPARE
Immigrants from Guyana
Immigrants from Uganda
Family Poverty
Family Poverty Comparison
Immigrants from Guyana
Immigrants from Uganda
11.2%
FAMILY POVERTY
0.1/ 100
METRIC RATING
276th/ 347
METRIC RANK
9.1%
FAMILY POVERTY
43.4/ 100
METRIC RATING
180th/ 347
METRIC RANK
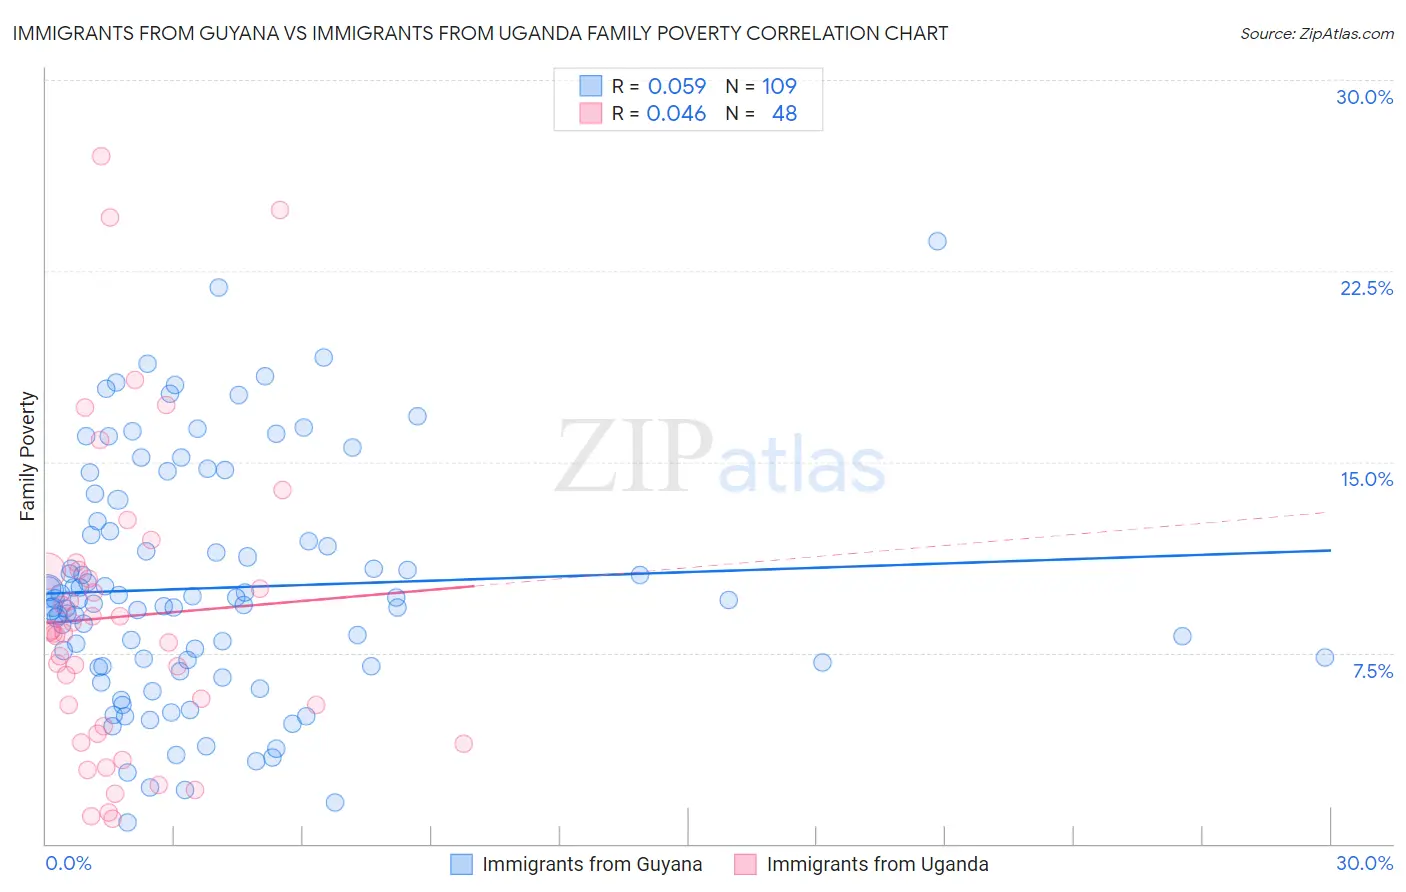
Immigrants from Guyana vs Immigrants from Uganda Family Poverty Correlation Chart
The statistical analysis conducted on geographies consisting of 183,364,556 people shows a slight positive correlation between the proportion of Immigrants from Guyana and poverty level among families in the United States with a correlation coefficient (R) of 0.059 and weighted average of 11.2%. Similarly, the statistical analysis conducted on geographies consisting of 125,892,815 people shows no correlation between the proportion of Immigrants from Uganda and poverty level among families in the United States with a correlation coefficient (R) of 0.046 and weighted average of 9.1%, a difference of 23.6%.
Family Poverty Correlation Summary
| Measurement | Immigrants from Guyana | Immigrants from Uganda |
| Minimum | 0.84% | 1.0% |
| Maximum | 23.6% | 27.0% |
| Range | 22.8% | 26.0% |
| Mean | 10.0% | 8.9% |
| Median | 9.6% | 8.3% |
| Interquartile 25% (IQ1) | 7.0% | 4.5% |
| Interquartile 75% (IQ3) | 12.5% | 10.7% |
| Interquartile Range (IQR) | 5.5% | 6.3% |
| Standard Deviation (Sample) | 4.6% | 6.1% |
| Standard Deviation (Population) | 4.6% | 6.0% |
Similar Demographics by Family Poverty
Demographics Similar to Immigrants from Guyana by Family Poverty
In terms of family poverty, the demographic groups most similar to Immigrants from Guyana are Central American (11.2%, a difference of 0.020%), Spanish American (11.2%, a difference of 0.070%), Chippewa (11.2%, a difference of 0.090%), Guyanese (11.2%, a difference of 0.12%), and Somali (11.2%, a difference of 0.16%).
| Demographics | Rating | Rank | Family Poverty |
| Immigrants | Ecuador | 0.1 /100 | #269 | Tragic 11.1% |
| Immigrants | Nicaragua | 0.1 /100 | #270 | Tragic 11.1% |
| Immigrants | Bahamas | 0.1 /100 | #271 | Tragic 11.1% |
| Immigrants | Jamaica | 0.1 /100 | #272 | Tragic 11.2% |
| Somalis | 0.1 /100 | #273 | Tragic 11.2% |
| Spanish Americans | 0.1 /100 | #274 | Tragic 11.2% |
| Central Americans | 0.1 /100 | #275 | Tragic 11.2% |
| Immigrants | Guyana | 0.1 /100 | #276 | Tragic 11.2% |
| Chippewa | 0.1 /100 | #277 | Tragic 11.2% |
| Guyanese | 0.1 /100 | #278 | Tragic 11.2% |
| Blackfeet | 0.0 /100 | #279 | Tragic 11.3% |
| Belizeans | 0.0 /100 | #280 | Tragic 11.3% |
| Immigrants | West Indies | 0.0 /100 | #281 | Tragic 11.3% |
| Immigrants | Cuba | 0.0 /100 | #282 | Tragic 11.3% |
| Indonesians | 0.0 /100 | #283 | Tragic 11.3% |
Demographics Similar to Immigrants from Uganda by Family Poverty
In terms of family poverty, the demographic groups most similar to Immigrants from Uganda are Immigrants from Iraq (9.1%, a difference of 0.13%), Hmong (9.1%, a difference of 0.43%), Immigrants from Morocco (9.1%, a difference of 0.43%), Immigrants from Cameroon (9.0%, a difference of 0.49%), and Hawaiian (9.0%, a difference of 0.50%).
| Demographics | Rating | Rank | Family Poverty |
| Immigrants | Fiji | 56.4 /100 | #173 | Average 8.9% |
| Immigrants | Albania | 50.0 /100 | #174 | Average 9.0% |
| Costa Ricans | 49.3 /100 | #175 | Average 9.0% |
| Immigrants | Syria | 47.5 /100 | #176 | Average 9.0% |
| Hawaiians | 47.2 /100 | #177 | Average 9.0% |
| Immigrants | Cameroon | 47.1 /100 | #178 | Average 9.0% |
| Immigrants | Iraq | 44.4 /100 | #179 | Average 9.1% |
| Immigrants | Uganda | 43.4 /100 | #180 | Average 9.1% |
| Hmong | 40.2 /100 | #181 | Average 9.1% |
| Immigrants | Morocco | 40.2 /100 | #182 | Average 9.1% |
| Uruguayans | 39.2 /100 | #183 | Fair 9.1% |
| South American Indians | 38.7 /100 | #184 | Fair 9.1% |
| Immigrants | Saudi Arabia | 38.6 /100 | #185 | Fair 9.1% |
| Colombians | 36.1 /100 | #186 | Fair 9.2% |
| Delaware | 35.4 /100 | #187 | Fair 9.2% |