Immigrants from Sierra Leone vs European Male Poverty
COMPARE
Immigrants from Sierra Leone
European
Male Poverty
Male Poverty Comparison
Immigrants from Sierra Leone
Europeans
11.4%
MALE POVERTY
32.9/ 100
METRIC RATING
186th/ 347
METRIC RANK
10.2%
MALE POVERTY
97.1/ 100
METRIC RATING
71st/ 347
METRIC RANK
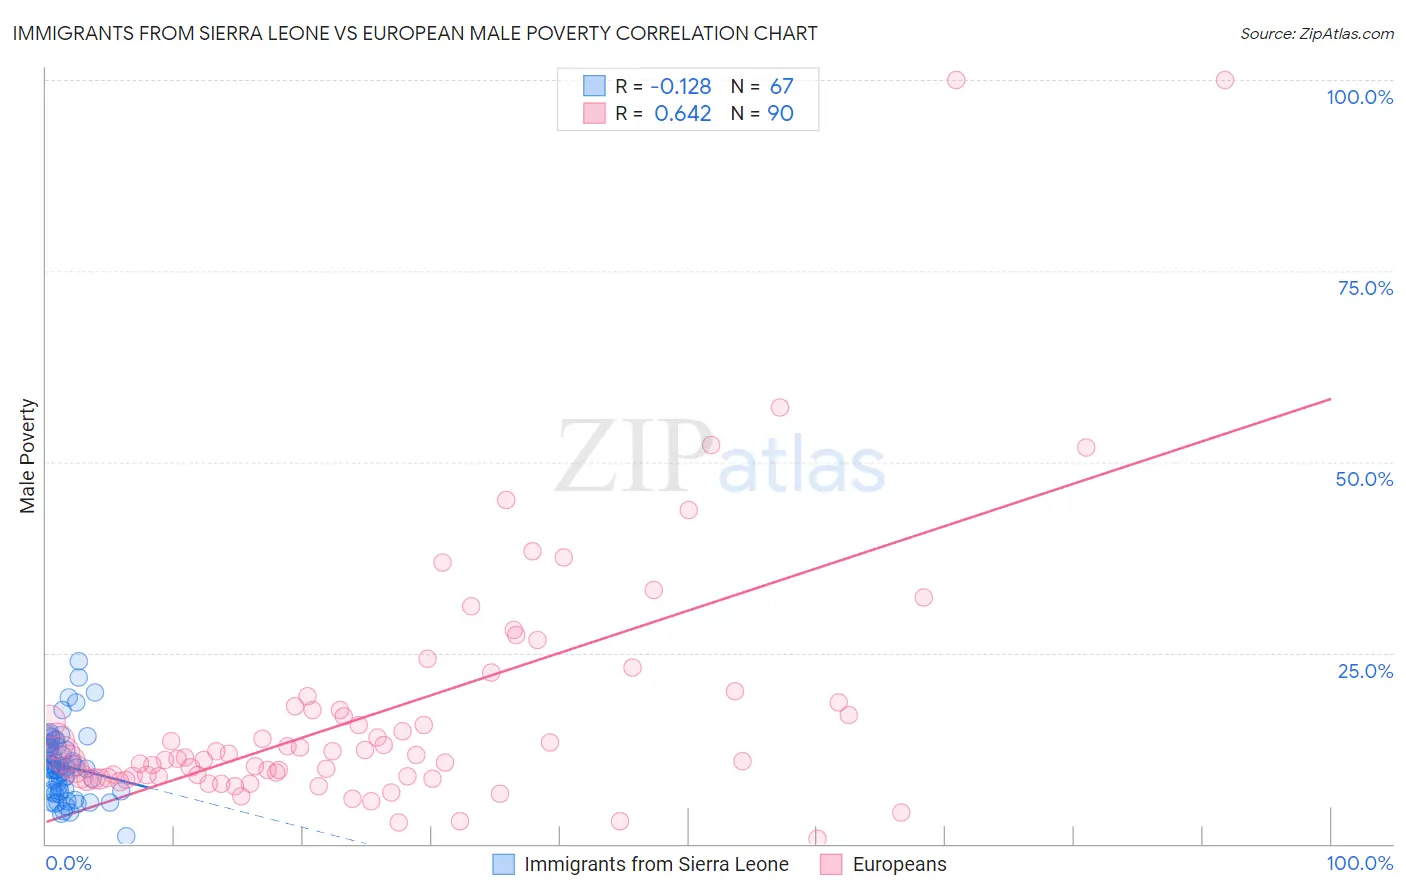
Immigrants from Sierra Leone vs European Male Poverty Correlation Chart
The statistical analysis conducted on geographies consisting of 101,636,986 people shows a poor negative correlation between the proportion of Immigrants from Sierra Leone and poverty level among males in the United States with a correlation coefficient (R) of -0.128 and weighted average of 11.4%. Similarly, the statistical analysis conducted on geographies consisting of 560,421,320 people shows a significant positive correlation between the proportion of Europeans and poverty level among males in the United States with a correlation coefficient (R) of 0.642 and weighted average of 10.2%, a difference of 11.3%.
Male Poverty Correlation Summary
| Measurement | Immigrants from Sierra Leone | European |
| Minimum | 1.0% | 0.73% |
| Maximum | 23.8% | 100.0% |
| Range | 22.8% | 99.3% |
| Mean | 10.2% | 17.4% |
| Median | 9.9% | 11.4% |
| Interquartile 25% (IQ1) | 6.9% | 8.8% |
| Interquartile 75% (IQ3) | 12.8% | 18.1% |
| Interquartile Range (IQR) | 5.9% | 9.3% |
| Standard Deviation (Sample) | 4.4% | 17.0% |
| Standard Deviation (Population) | 4.4% | 16.9% |
Similar Demographics by Male Poverty
Demographics Similar to Immigrants from Sierra Leone by Male Poverty
In terms of male poverty, the demographic groups most similar to Immigrants from Sierra Leone are Immigrants from Afghanistan (11.4%, a difference of 0.050%), Immigrants from Iraq (11.4%, a difference of 0.11%), Sierra Leonean (11.4%, a difference of 0.33%), Immigrants from South America (11.3%, a difference of 0.43%), and Hawaiian (11.4%, a difference of 0.52%).
| Demographics | Rating | Rank | Male Poverty |
| Immigrants | Syria | 40.3 /100 | #179 | Average 11.3% |
| Immigrants | Morocco | 40.1 /100 | #180 | Average 11.3% |
| Immigrants | Costa Rica | 39.5 /100 | #181 | Fair 11.3% |
| Mongolians | 39.0 /100 | #182 | Fair 11.3% |
| Kenyans | 38.4 /100 | #183 | Fair 11.3% |
| Immigrants | South America | 36.9 /100 | #184 | Fair 11.3% |
| Immigrants | Afghanistan | 33.3 /100 | #185 | Fair 11.4% |
| Immigrants | Sierra Leone | 32.9 /100 | #186 | Fair 11.4% |
| Immigrants | Iraq | 31.9 /100 | #187 | Fair 11.4% |
| Sierra Leoneans | 29.9 /100 | #188 | Fair 11.4% |
| Hawaiians | 28.3 /100 | #189 | Fair 11.4% |
| Israelis | 26.1 /100 | #190 | Fair 11.5% |
| South American Indians | 22.8 /100 | #191 | Fair 11.5% |
| Immigrants | Uruguay | 19.1 /100 | #192 | Poor 11.6% |
| Immigrants | Kuwait | 17.3 /100 | #193 | Poor 11.6% |
Demographics Similar to Europeans by Male Poverty
In terms of male poverty, the demographic groups most similar to Europeans are Immigrants from Canada (10.2%, a difference of 0.010%), Paraguayan (10.2%, a difference of 0.030%), Immigrants from Australia (10.2%, a difference of 0.040%), Immigrants from Asia (10.2%, a difference of 0.090%), and Immigrants from Eastern Europe (10.2%, a difference of 0.16%).
| Demographics | Rating | Rank | Male Poverty |
| Swiss | 97.5 /100 | #64 | Exceptional 10.2% |
| Zimbabweans | 97.5 /100 | #65 | Exceptional 10.2% |
| Serbians | 97.5 /100 | #66 | Exceptional 10.2% |
| Immigrants | Netherlands | 97.3 /100 | #67 | Exceptional 10.2% |
| Immigrants | Sri Lanka | 97.2 /100 | #68 | Exceptional 10.2% |
| Immigrants | Australia | 97.1 /100 | #69 | Exceptional 10.2% |
| Paraguayans | 97.1 /100 | #70 | Exceptional 10.2% |
| Europeans | 97.1 /100 | #71 | Exceptional 10.2% |
| Immigrants | Canada | 97.1 /100 | #72 | Exceptional 10.2% |
| Immigrants | Asia | 97.0 /100 | #73 | Exceptional 10.2% |
| Immigrants | Eastern Europe | 96.9 /100 | #74 | Exceptional 10.2% |
| Carpatho Rusyns | 96.9 /100 | #75 | Exceptional 10.2% |
| Dutch | 96.9 /100 | #76 | Exceptional 10.2% |
| Immigrants | Belgium | 96.8 /100 | #77 | Exceptional 10.3% |
| Irish | 96.8 /100 | #78 | Exceptional 10.3% |